Bitcoin at a Crossroads as Long-Term Trend Signals Clash

Bitcoin continues to trade sideways near the $90,000 level, keeping the market in a state of hesitation as traders look for clearer direction.
Despite several attempts to regain upside momentum, price action remains constrained within a well-defined range, with both technical and on-chain signals offering conflicting interpretations of what may come next.
Key Takeaways:
- Bitcoin is stuck in a tight range around $90,000, with no clear trend yet.
- The 200-day moving average is the main decision point for the next major move.
- Indicators and on-chain data suggest caution rather than strong bullish momentum.
One of the most important technical levels currently in focus is the 200-day moving average. Market analyst Crypto Rover points out that this level has historically acted as a decisive pivot during major cycle transitions. In previous market tops, Bitcoin managed to briefly reclaim the 200-day MA before getting rejected, followed by a deeper corrective phase.
This historical context is driving caution among traders. A rejection at this level would reinforce concerns that Bitcoin is following a familiar late-cycle script. On the other hand, a sustained move above the 200-day MA would be a notable deviation from past behavior and could suggest the market is attempting to break away from the traditional four-year cycle framework.
For Bitcoin’s relief rally, the 200-day moving average is a key level to watch.
There is a high chance Bitcoin gets rejected here, as it did in previous cycles after first marking the cycle top.
Clean break above this level could signal a break from the traditional four-year… pic.twitter.com/odExoOXUjT
— Crypto Rover (@cryptorover) January 3, 2026
Momentum indicators show stabilization, not conviction
Short-term indicators are showing early signs of stabilization, but they stop well short of confirming a bullish reversal. On the daily timeframe, RSI has climbed back into the low-50s, indicating neutral momentum rather than strong buying pressure. This suggests that selling has cooled, but buyers are not yet in full control.
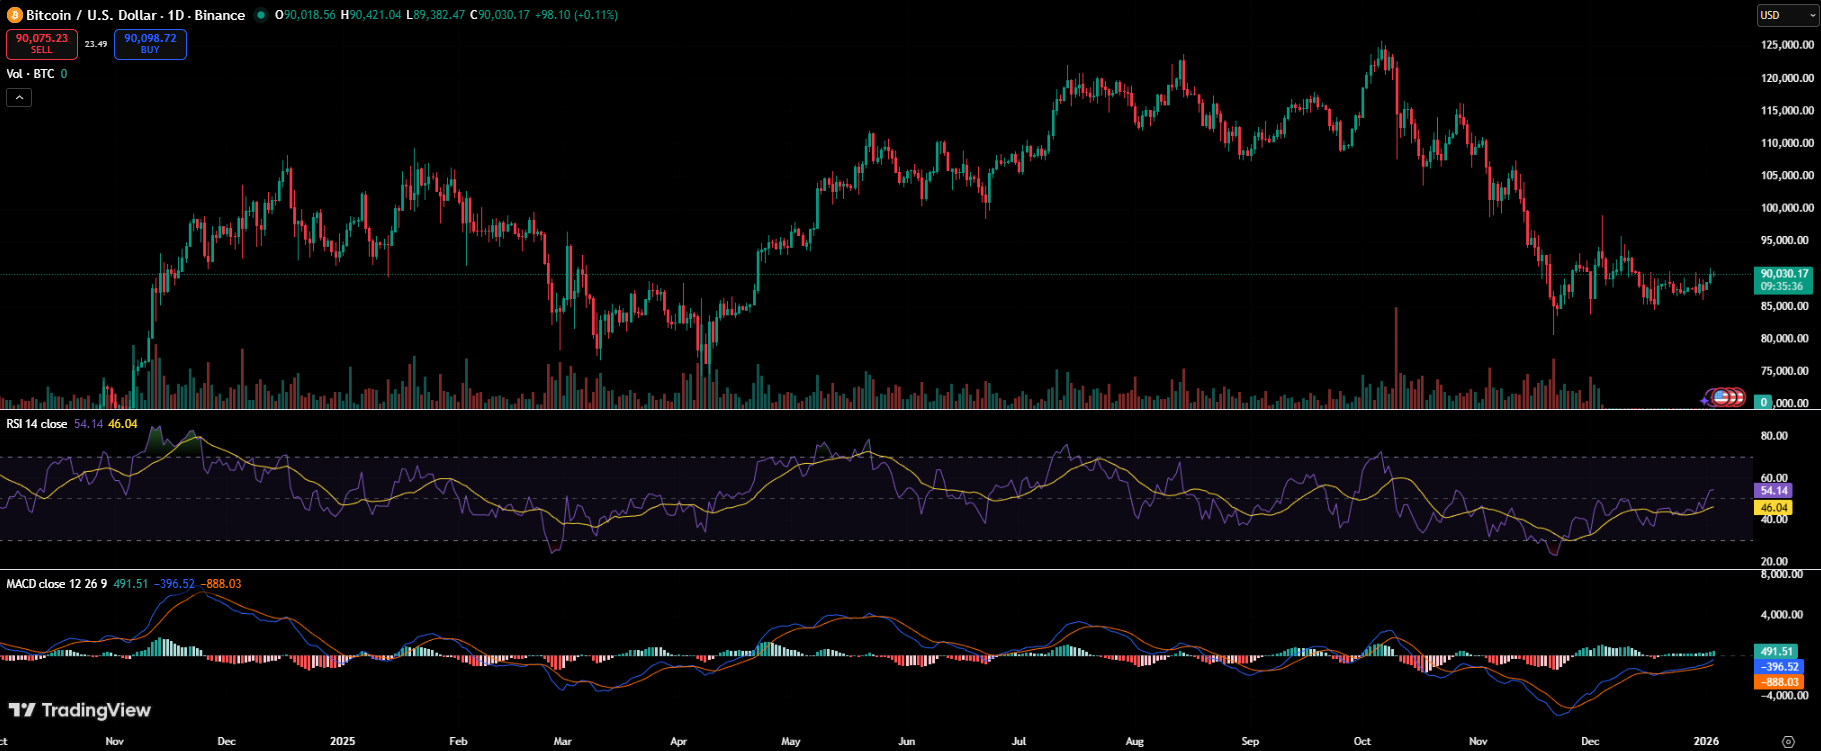
MACD tells a similar story. After spending an extended period in negative territory, the indicator has started to flatten, hinting that downside momentum is losing strength. However, without a clear bullish crossover, the signal remains tentative. Trading volume also remains relatively subdued, reinforcing the idea that the market is waiting for a catalyst rather than positioning aggressively.
On-chain data raises late-cycle questions
On-chain metrics are adding to the uncertainty. According to data from CryptoQuant, Bitcoin’s supply in profit is hovering around the 70% level. Historically, this zone has often acted as a transition point, especially during periods when price consolidates rather than trends decisively.
Bitcoin Cycle: Entering a Transition Toward a Bear Market?
“If price action continues to consolidate and the metric stagnates around the 70% level, historical cycles suggest an increasing likelihood of a transition into a broader bear market.” – By @Yonsei_dent pic.twitter.com/8DkHWv6Vh3
— CryptoQuant.com (@cryptoquant_com) January 2, 2026
If Bitcoin continues to move sideways while this metric stagnates, historical cycles suggest an increased probability of a broader bearish phase developing over time. That said, this signal is not definitive on its own. In previous instances, the market has also managed to stabilize around this level before resuming its uptrend, making context and confirmation critical.
Short-term levels that could shape the next move
From a near-term trading perspective, analyst Michaël van de Poppe emphasizes the importance of the 21-day moving average. This level is currently acting as a key support zone within the range. As long as Bitcoin holds above it, the structure remains constructive enough to allow for another challenge of resistance.
#Bitcoin is still stuck in the range, as a breakout upwards didn't happen.
For me, a crucial level is the 21-Day MA to hold onto.
If that does provide support and there's another attack of the $91K resistance zone in the coming days, I would assume the markets will be trending… pic.twitter.com/Vq2oZFQhAp
— Michaël van de Poppe (@CryptoMichNL) January 3, 2026
The $91,000 area stands out as the next major hurdle. A successful break and hold above this zone would likely improve sentiment and could attract fresh momentum traders. Failure to do so, especially if accompanied by a loss of short-term support, would increase the risk of another move toward the lower end of the range.
A market waiting for confirmation
At the time of writing, Bitcoin is trading around $90,100, showing modest daily gains and a slightly positive weekly performance. Its market capitalization is close to $1.8 trillion, with 24-hour trading volume hovering near $40 billion. These figures reflect steady participation, but not the kind of activity typically associated with strong directional moves.
For now, Bitcoin remains caught between competing narratives. Bulls are watching for confirmation above key moving averages to validate a recovery and potential cycle extension, while bears point to historical patterns and on-chain signals that argue for caution. Until a decisive breakout or breakdown occurs, consolidation and heightened sensitivity to technical levels are likely to define the market’s near-term behavior.
The information provided in this article is for educational purposes only and does not constitute financial, investment, or trading advice. Coindoo.com does not endorse or recommend any specific investment strategy or cryptocurrency. Always conduct your own research and consult with a licensed financial advisor before making any investment decisions.


Alexander Zdravkov is a person who always looks for the logic behind things. He has more than 3 years of experience in the crypto space, where he skillfully identifies new trends in the world of digital currencies. Whether providing in-depth analysis or daily reports on all topics, his deep understanding and enthusiasm for what he does make him a valuable member of the team.