Gold and Silver Absorb Volatility and Rebound After Failed Breakout Attempts

Gold and silver experienced extreme volatility in early February, with both metals surging toward long-term all-time-high reference zones before facing sharp corrections and subsequent recoveries.
Key takeaways
- Gold tested the $5,500 all-time-high reference zone but failed to hold above it
- Silver surged toward the $120 historical peak, followed by a deep but controlled correction
- Both metals experienced double-digit percentage declines from their highs before rebounding
- Momentum remains elevated, but price is now stabilizing below long-term resistance levels
The price action reflects momentum-driven acceleration into historical resistance, followed by aggressive profit-taking rather than sustained price discovery beyond prior extremes.
Gold: Spike Toward $5,500 Followed by Sharp Pullback and Stabilization
Gold surged aggressively, briefly reaching into the $5,500 area, which marks its historical all-time-high reference zone, before being decisively rejected. From the intraday peak, gold declined by roughly 10–12%, as selling pressure emerged near long-term resistance.
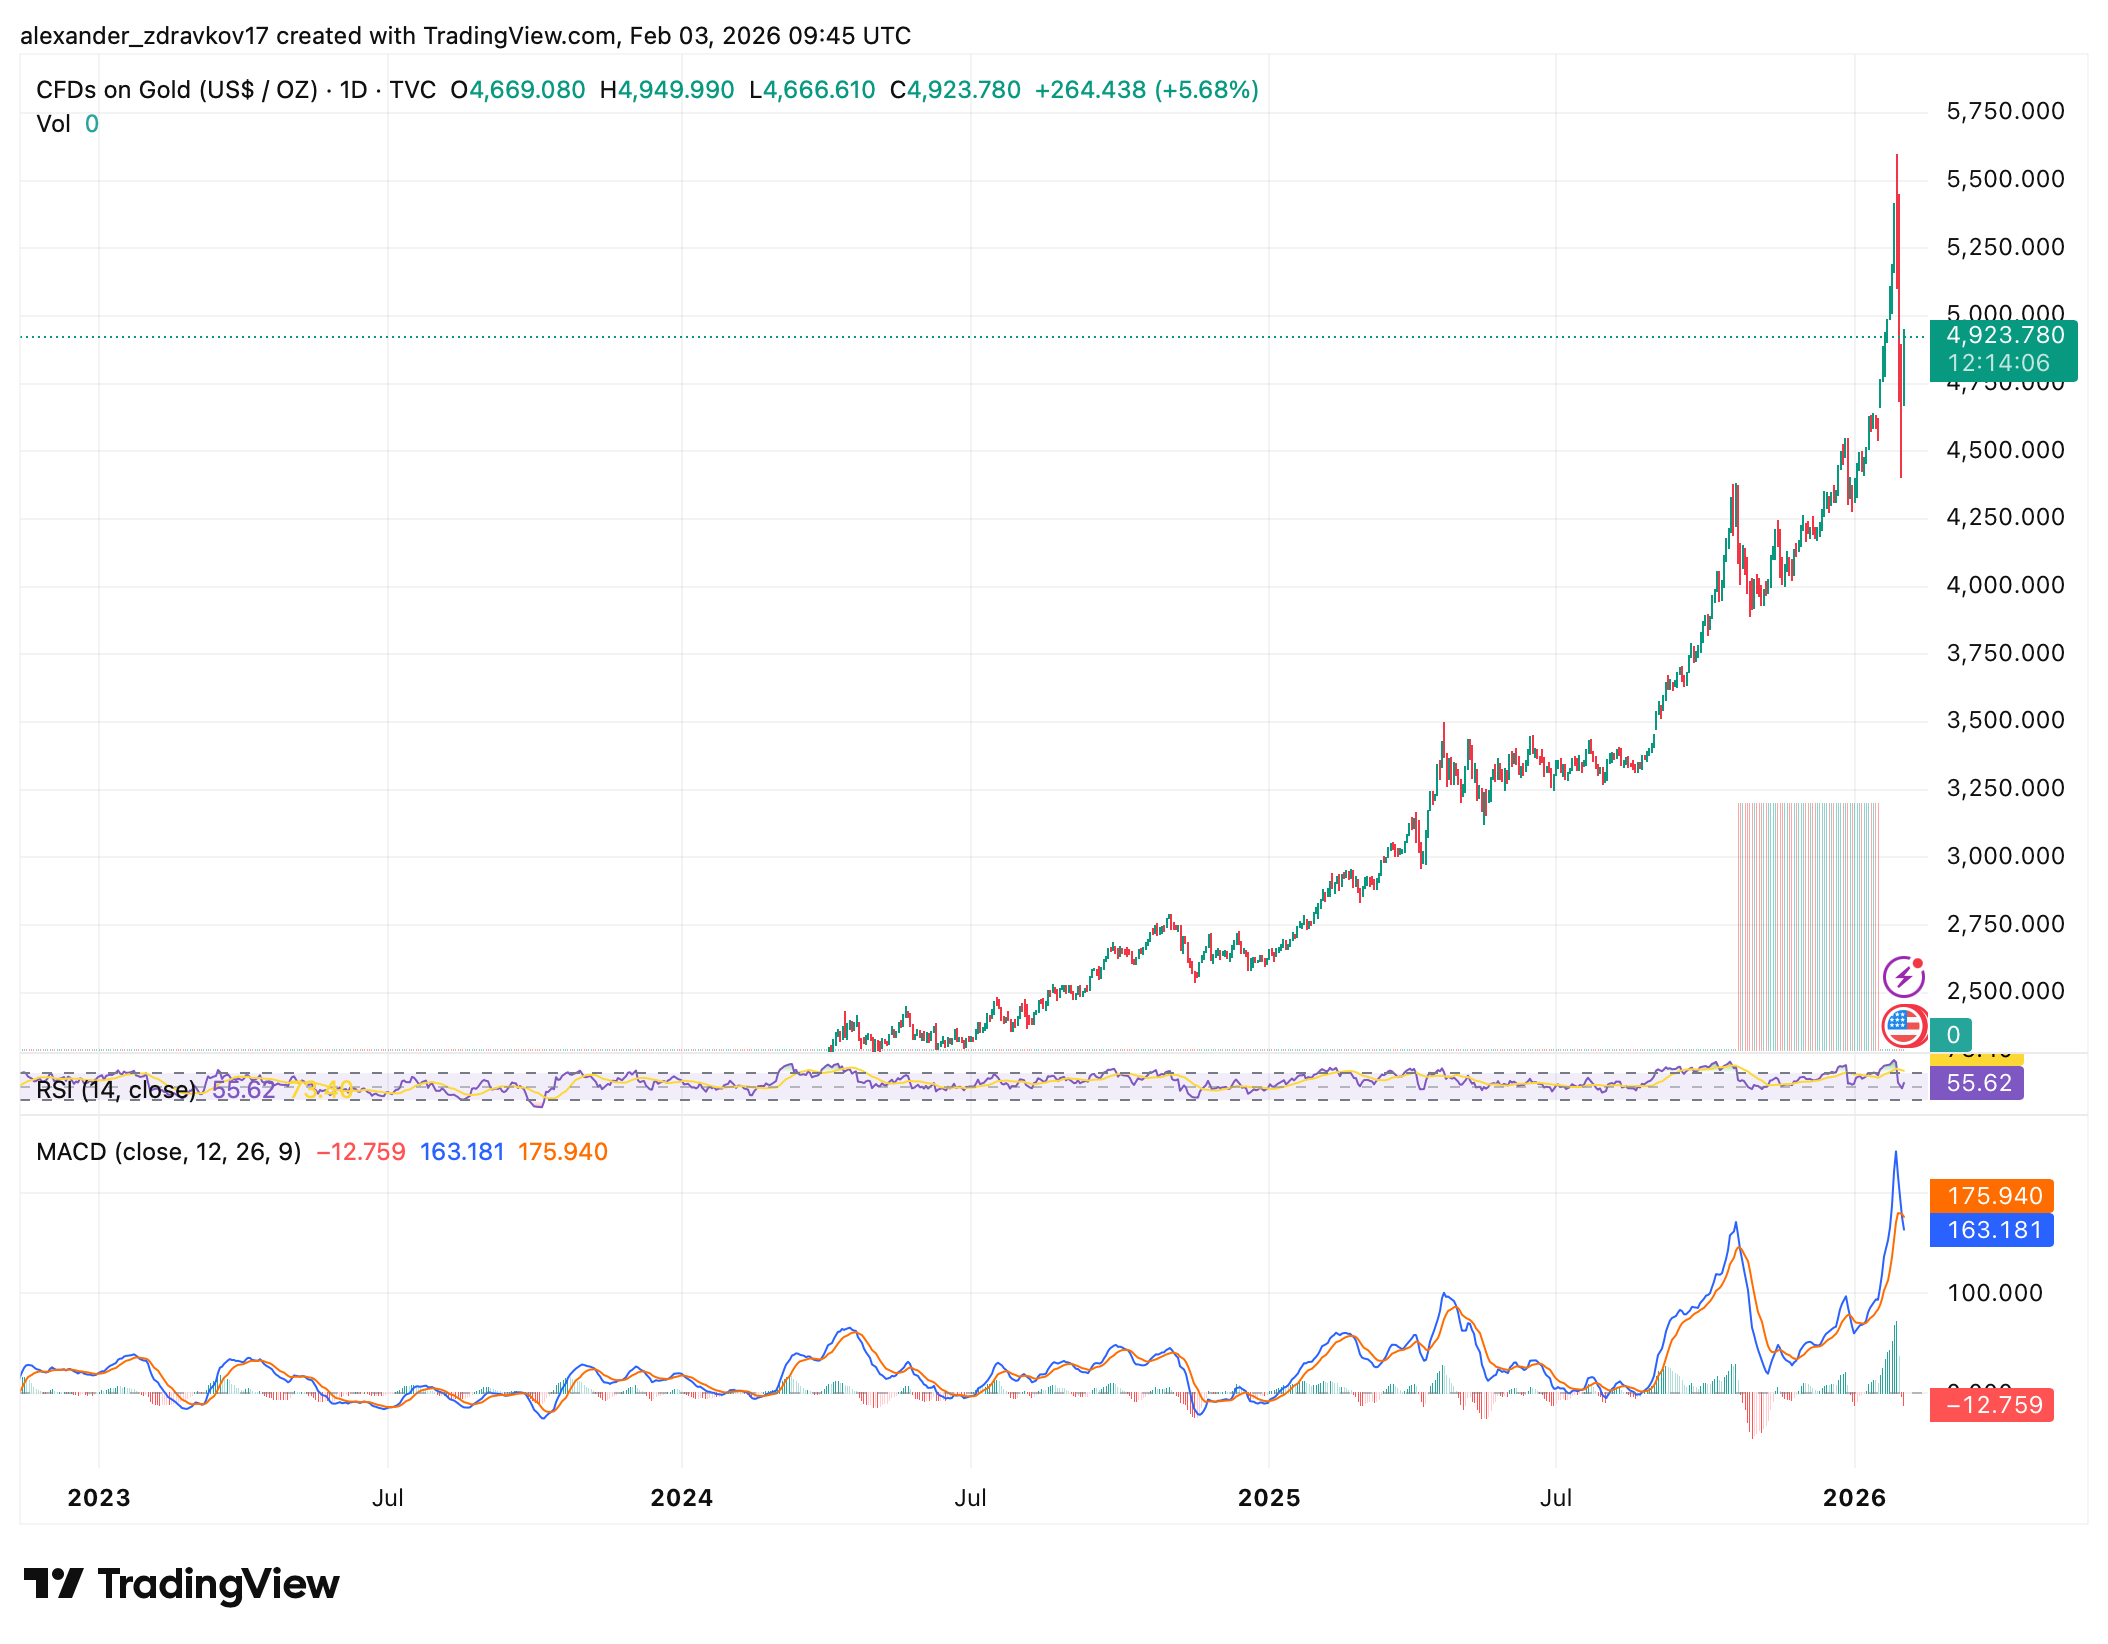
Despite the rejection, gold has since recovered strongly, closing near $4,924, up +5.68% on the day, indicating that buyers are still active below the highs. The rebound suggests structural demand remains intact, even as upside momentum cools.
From a technical perspective:
- RSI (~55) sits in neutral territory, signaling neither exhaustion nor weakness
- MACD remains positive, though momentum has slowed after the spike
- Price continues to trade well above long-term trend support
Overall, gold remains in a bullish structure, but the failure at $5,500 reinforces that the level remains a critical ceiling.
Silver: Violent Rejection Below $120 Followed by Partial Recovery
Silver displayed even more extreme volatility. Price accelerated rapidly toward the $120 all-time-high zone, but failed to sustain the move, triggering a steep correction. From the high, silver dropped approximately 25–30%, reflecting heavy speculative positioning and rapid deleveraging.
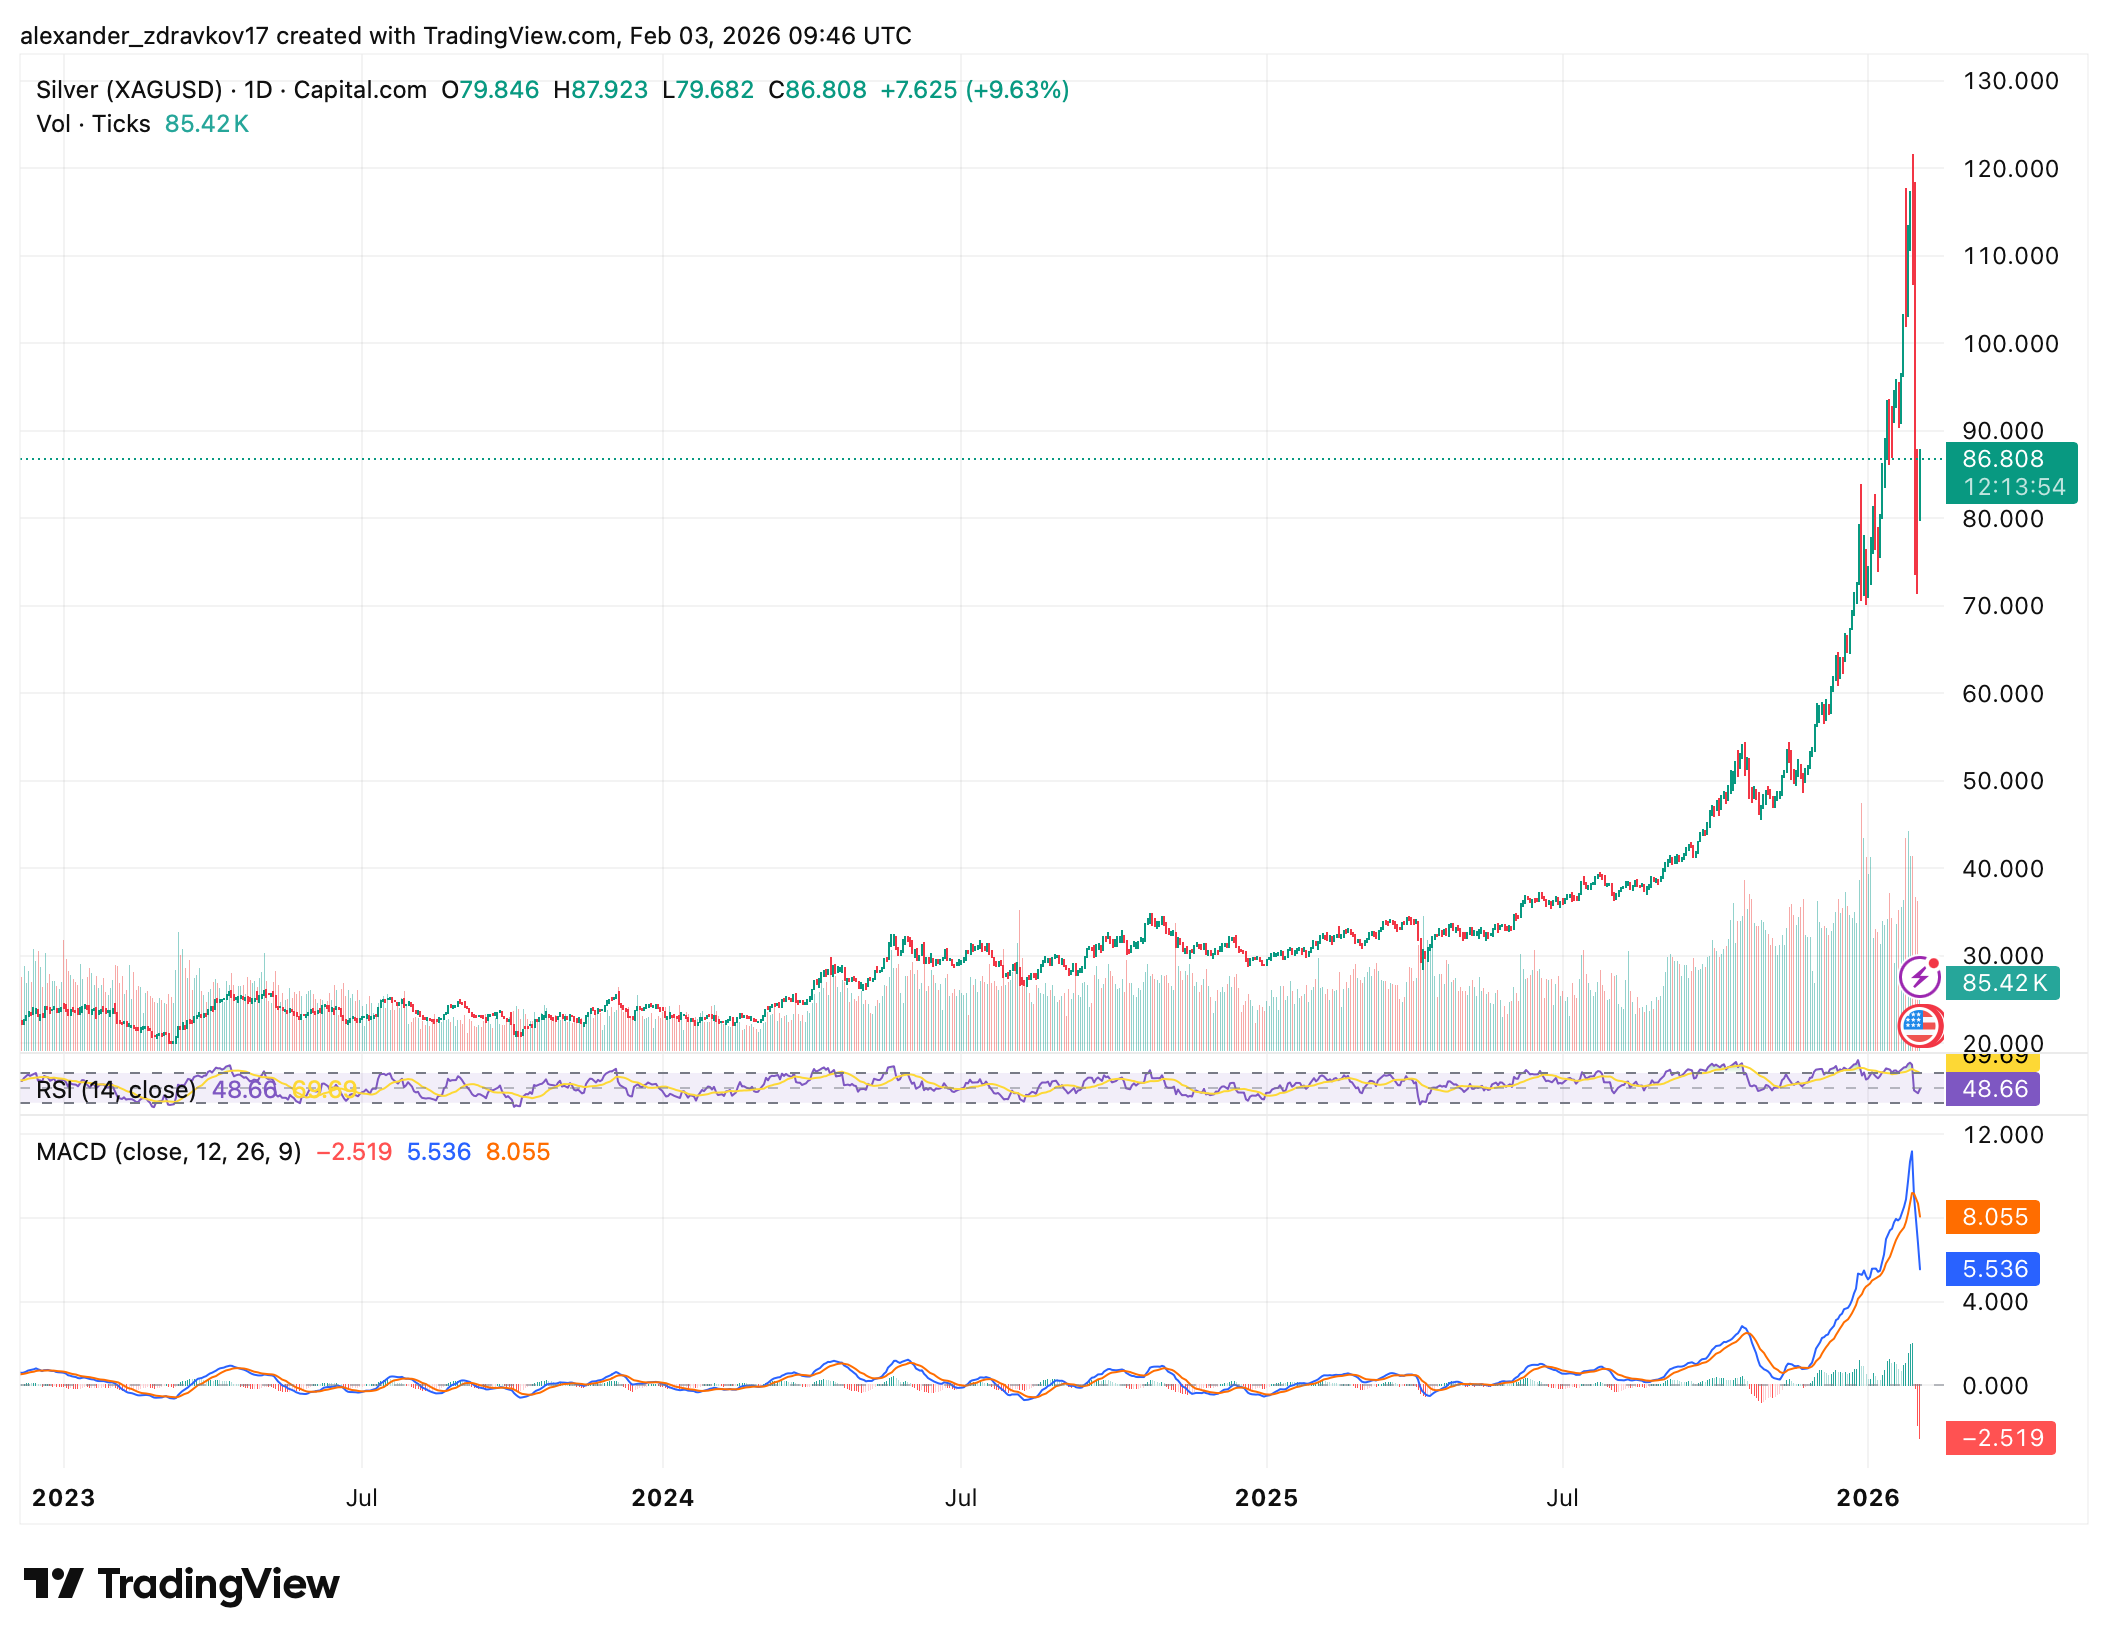
Following the sell-off, silver rebounded to around $86.8, posting a +9.63% daily gain, signaling aggressive dip-buying and renewed interest after the washout.
Technically:
- RSI (~48) shows silver has reset from overbought conditions
- MACD momentum has rolled over but remains elevated relative to historical baselinesVolume expanded significantly during both the surge and the correction, confirming strong market participation

Silver remains well below its historical extreme, but the recovery suggests the broader uptrend has not been invalidated.
What the Charts Are Actually Signaling
The synchronized behavior in gold and silver points to late-cycle acceleration into long-term resistance, followed by necessary and healthy corrections, not confirmed breakouts above all-time highs.
- $5,500 (gold) and $120 (silver) remain unbroken historical ceilings
- Recoveries indicate continued underlying demand, but conviction fades near extremes
- Elevated volatility suggests the market is transitioning from impulse to consolidation
In short, the charts show stress-testing of historical limits, not sustained price discovery – with the next phase likely defined by consolidation, further volatility, or renewed attempts higher depending on macro conditions.
The information provided in this article is for educational purposes only and does not constitute financial, investment, or trading advice. Coindoo.com does not endorse or recommend any specific investment strategy or cryptocurrency. Always conduct your own research and consult with a licensed financial advisor before making any investment decisions.

Alexander Zdravkov is a person who always looks for the logic behind things. He has more than 3 years of experience in the crypto space, where he skillfully identifies new trends in the world of digital currencies. Whether providing in-depth analysis or daily reports on all topics, his deep understanding and enthusiasm for what he does make him a valuable member of the team.