Ethereum Might be at Its Most Technically Important Level in Months

Ethereum is holding a multi-year trendline while realized volatility hits its lowest level since January, a compression that historically precedes a significant move in either direction.
Key Takeaways
- ETH recovers to $2,063 after touching $1,970 low on March 30.
- 50 SMA curves upward below price for first time in weeks.
- 30-day realized volatility hits lowest level since January 2026.
- Weekly trendline holding after multiple retests since 2022.
- ETH outperforming Bitcoin – van de Poppe flags 0.03250 as key level.
Ethereum dropped to $1,970 in the early hours of March 30 and recovered to $2,063 within the same session. The recovery sits on top of three technical signals that have been building simultaneously, a weekly trendline holding after its third retest, realized volatility at its lowest since January, and ETH beginning to outperform Bitcoin on the ratio chart for the first time in weeks. Each signal points in the same direction. One of them also points in the opposite direction depending on how the next move resolves.
What the Chart Shows
On the one-hour Binance chart, Ethereum opened the week of March 25 near $2,180 and sold off sharply through March 26, dropping to lows near $1,970 on March 27. A gradual recovery through March 28 and 29 was interrupted by a sharp dip back to $1,970 in the early hours of March 30 before the strongest buying candle of the week pushed price to $2,080 before settling at $2,063.
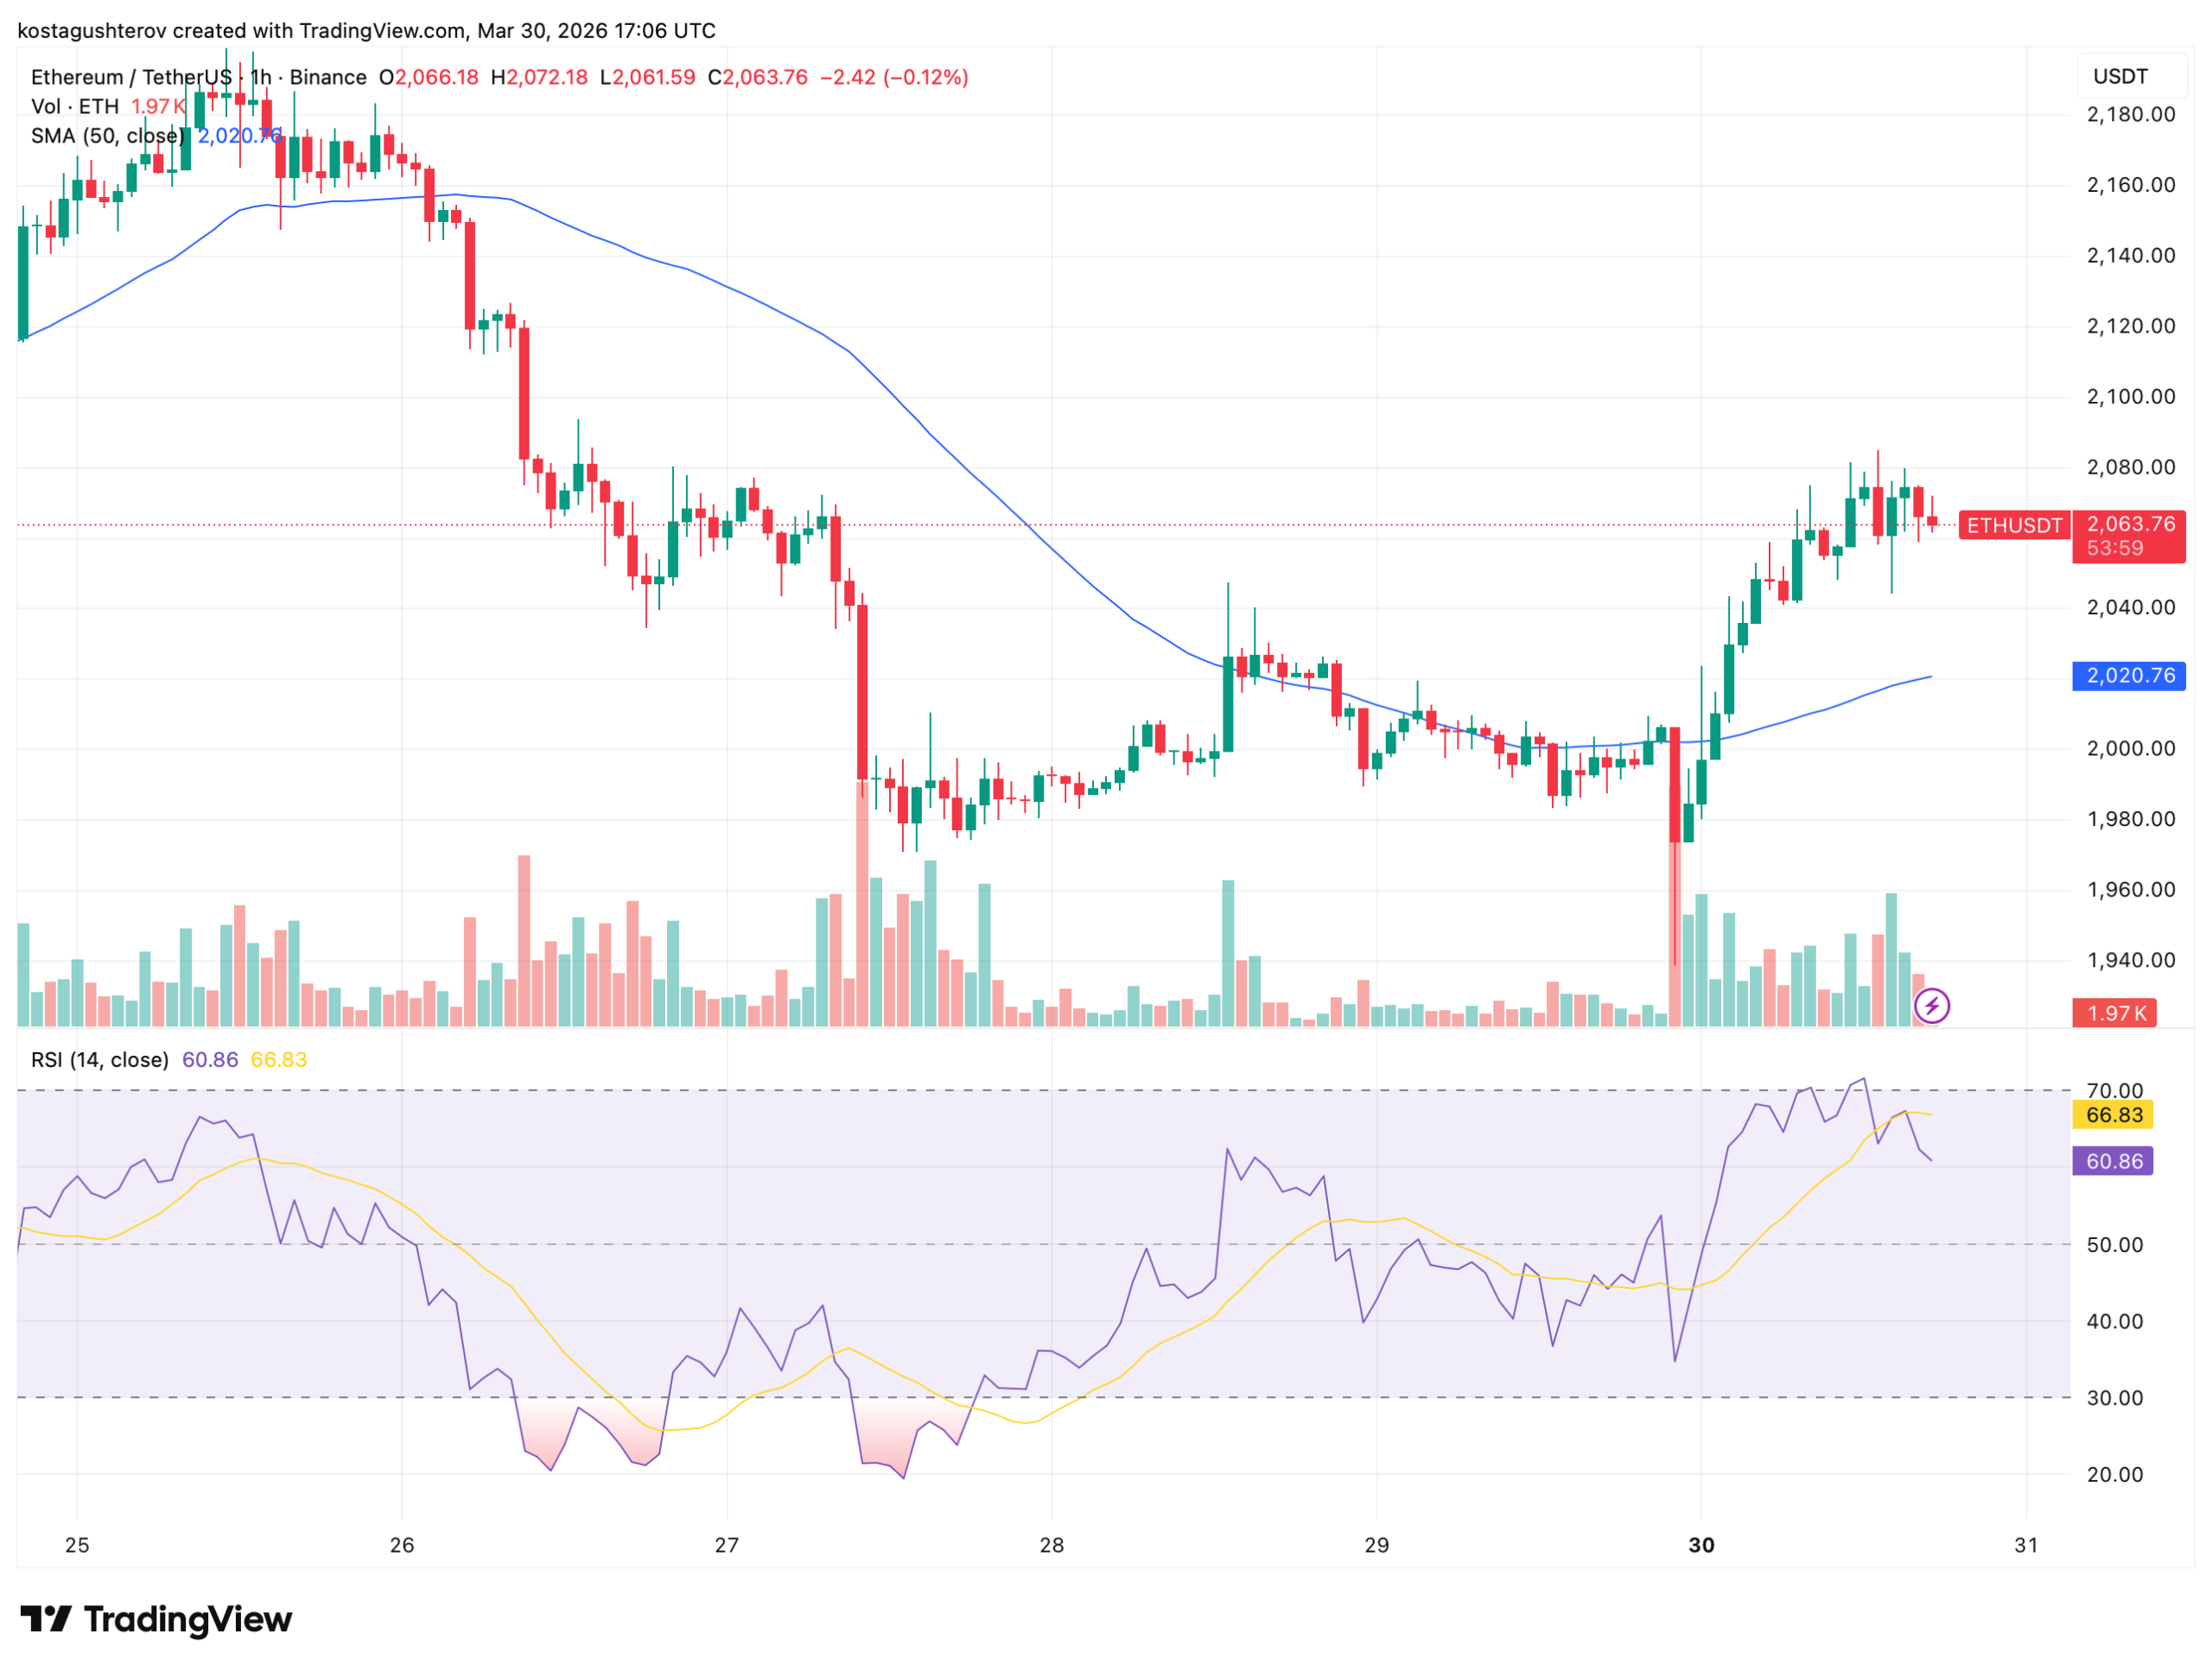
The 50-period simple moving average sits at $2,020.76, below current price and curving upward. For the first time in this chart window, the 50 SMA has stopped declining and is beginning to rise below a price that has held above it. That configuration changes the moving average from overhead resistance into rising support below price.
The RSI reads 60.86 against a smoothed signal at 66.83. Raw momentum is pulling back below its own average after spiking to near-overbought levels on the March 30 recovery candle, buying conviction ran hard and is now consolidating rather than extending. The momentum is present. It has not confirmed a sustained trend.
The volatility picture adds a layer of context that the one-hour chart alone cannot provide.
What the Volatility Data Shows
Ethereum’s 30-day realized volatility on Binance has dropped to 0.62 – its lowest level since January 2026, according to CryptoQuant data. The volatility Z-Score currently reads -0.43, placing current volatility levels below the historical average and confirming an unusual period of market calm relative to the preceding months.
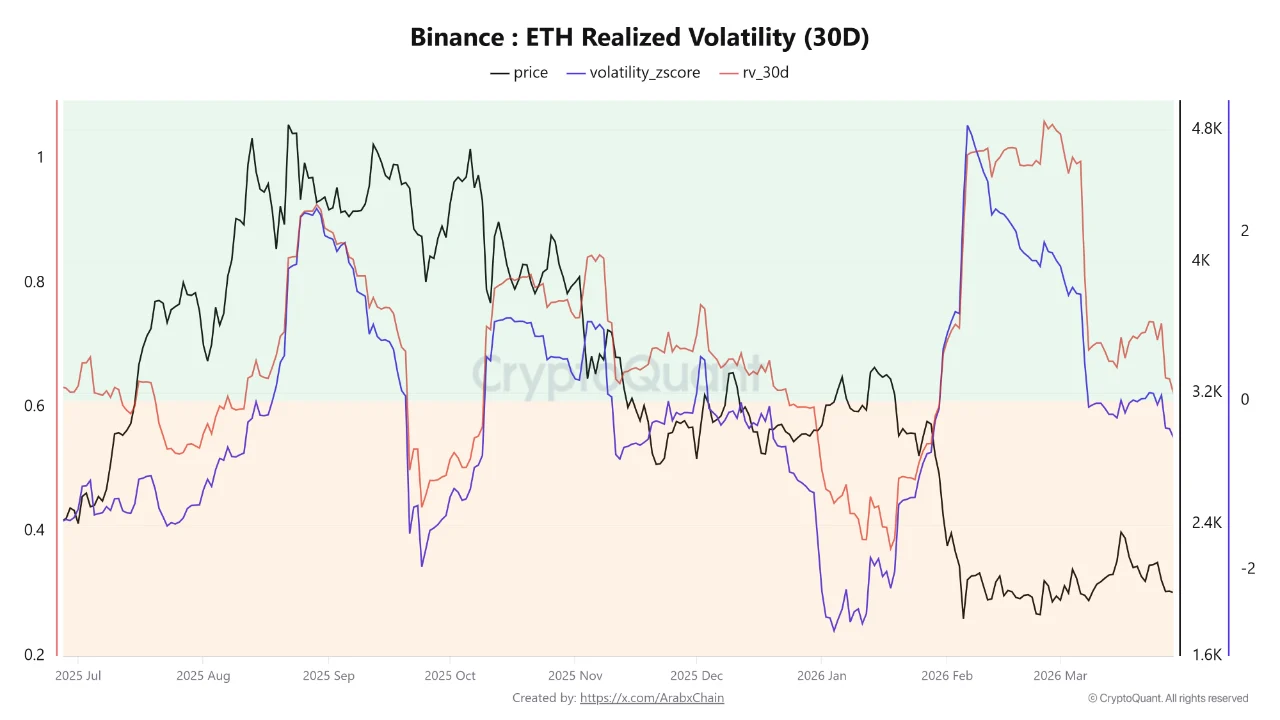
Low realized volatility with a negative Z-Score describes a market where the range of daily price movement has compressed to historically quiet levels. The analytical significance of that compression is specific: historically, when Ethereum’s volatility Z-Score falls into negative territory, it has preceded strong subsequent price movements. The compression itself is neither bullish nor bearish, it is a coiled spring. The direction depends on which trigger arrives first.
What makes the current compression more consequential is where it is occurring. Ethereum is not consolidating in the middle of nowhere. It is consolidating at a level that has defined its long-term structure for years.
The Weekly Trendline
On the weekly chart, Ethereum is trading back near a long-term rising support trendline that has been respected multiple times since 2022, as identified by Bitcoinsensus. The trendline has held at each prior test, in mid-2022, again in 2023, and now in early 2026. Each retest that holds adds weight to the level as structural support. Each retest that fails becomes a breakdown.
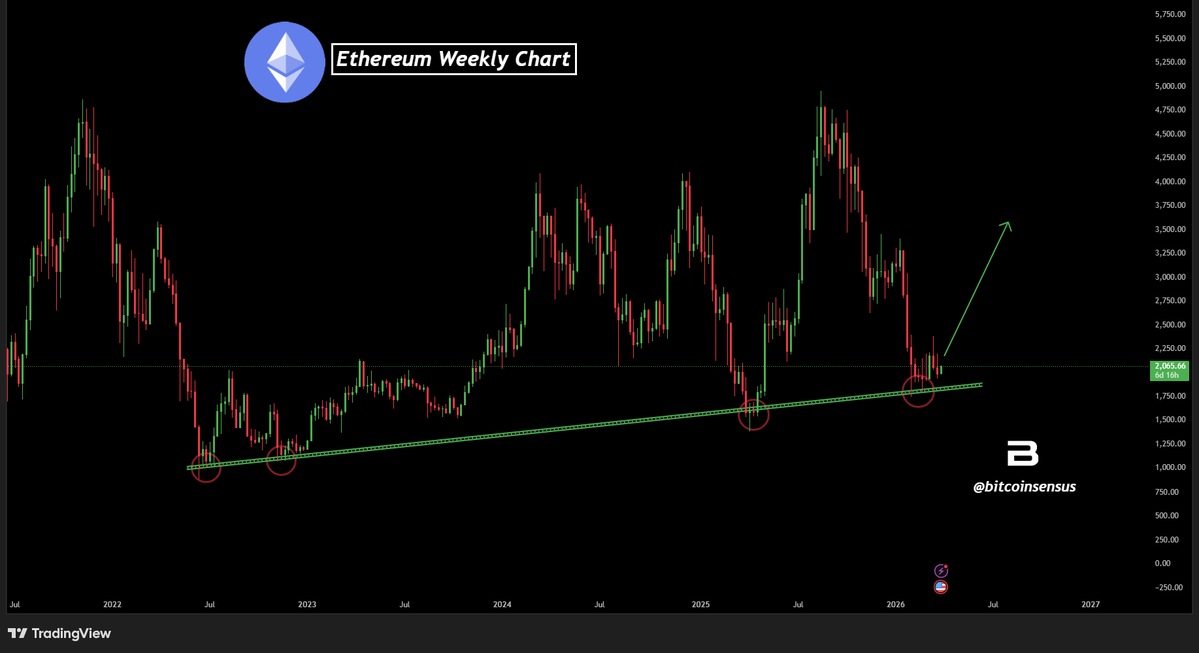
The current price of $2,063 places Ethereum directly at this trendline area for a third time. The pattern of prior respects makes the level structurally important. Whether this constitutes a hold or a retest in progress is what the next weekly close will determine. At $2,063, that question is open.
What the ETH/BTC Ratio Is Saying
Michaël van de Poppe, market analyst posting as @CryptoMichNL, noted on March 30 that Ethereum is currently outperforming Bitcoin — an observation he described as “a good sign” given the broader market context. The ETH/BTC ratio sits at approximately 0.03258, just above the 0.03250 level van de Poppe identified as the key threshold for confirming momentum. A sustained break above 0.03250 would, in his assessment, signal strong continuation in Ethereum’s relative performance against Bitcoin.
The markets are waking up, and $ETH is outperforming #Bitcoin.
That's a good sign.
However, for clear momentum, just break through 0.03250 $BTC and I'd be very happy as then I think we'll start to see strong continuation taking place. pic.twitter.com/BwYjp5rUTB
— Michaël van de Poppe (@CryptoMichNL) March 30, 2026
ETH outperforming Bitcoin during a period of market recovery carries a specific meaning. In prior cycles, altcoin outperformance of Bitcoin has been an early signal of broadening market participation, capital rotating from Bitcoin dominance into higher-beta assets. The ratio is not yet through the threshold. It is sitting at it.
Conclusion
Three signals converging is a strong setup. None of them are confirmed.
The weekly trendline is being retested, not reclaimed. A trendline that has been respected three times carries structural weight, and a fourth test at the same level without a decisive bounce carries the same analytical warning. The more times a support level is tested, the more likely it eventually gives way. Prior respects do not guarantee the current one.
The volatility compression cuts both ways. A 30-day realized volatility at its lowest since January precedes a significant move, but significant moves include sharp declines as well as recoveries. The negative Z-Score describes calm before movement, not calm before a rally specifically.
The RSI at 60.86 is pulling back below its smoothed average after a single-session spike. That pattern is more consistent with a relief bounce being absorbed than with a confirmed momentum shift. The 50 SMA is curving upward, which is constructive, but it is doing so from below $2,020 while price is at $2,063. Any session that closes back below the moving average removes that signal entirely.
Ethereum is at a structurally important level, with volatility compressed to historic lows and the ETH/BTC ratio sitting at its key threshold. The signals are aligned. Aligned signals at a major support level either confirm the case for recovery or make the breakdown, when it comes, look that much more decisive.
The weekly close will say more than any of the signals currently visible on the hourly chart.
The information provided in this article is for educational purposes only and does not constitute financial, investment, or trading advice. Coindoo.com does not endorse or recommend any specific investment strategy or cryptocurrency. Always conduct your own research and consult with a licensed financial advisor before making any investment decisions.

Kosta joined the team in 2021 and quickly established himself with his thirst for knowledge, incredible dedication, and analytical thinking. He not only covers a wide range of current topics, but also writes excellent reviews, PR articles, and educational materials. His articles are also quoted by other news agencies.