ETH Taker Ratio Turns Bullish: Institutions Already Left

A Pakistan-brokered 14-day ceasefire between the US and Iran sent ETH surging over $200 in hours. The on-chain data that preceded the move tells a more complicated story.
Key Takeaways
- US-Iran ceasefire drove ETH from $2,060 to $2,280 on April 8.
- Taker buy ratio rising structurally for four to five months.
- CME options conviction collapsed since October 2025.
- Spot ETF assets nearly halved from January peak to $11.98B.
- Ceasefire lasts 14 days with core terms still unresolved.
The Biggest Catalyst in Months
Ethereum surged from $2,060 to $2,280 on the news that the US and Iran had agreed to a two-week ceasefire, brokered by Pakistan which also sent Bitcoin above $71,000, ending 40 days of US-Israeli strikes that had disrupted global shipping and sent oil prices surging. Iran confirmed it would reopen the Strait of Hormuz for the duration of the truce. The $220 move came within hours of the announcement. By the time of writing, price pulled back to $2,190.
The catalyst was real. So was what came before it.
Buyers Were Already There
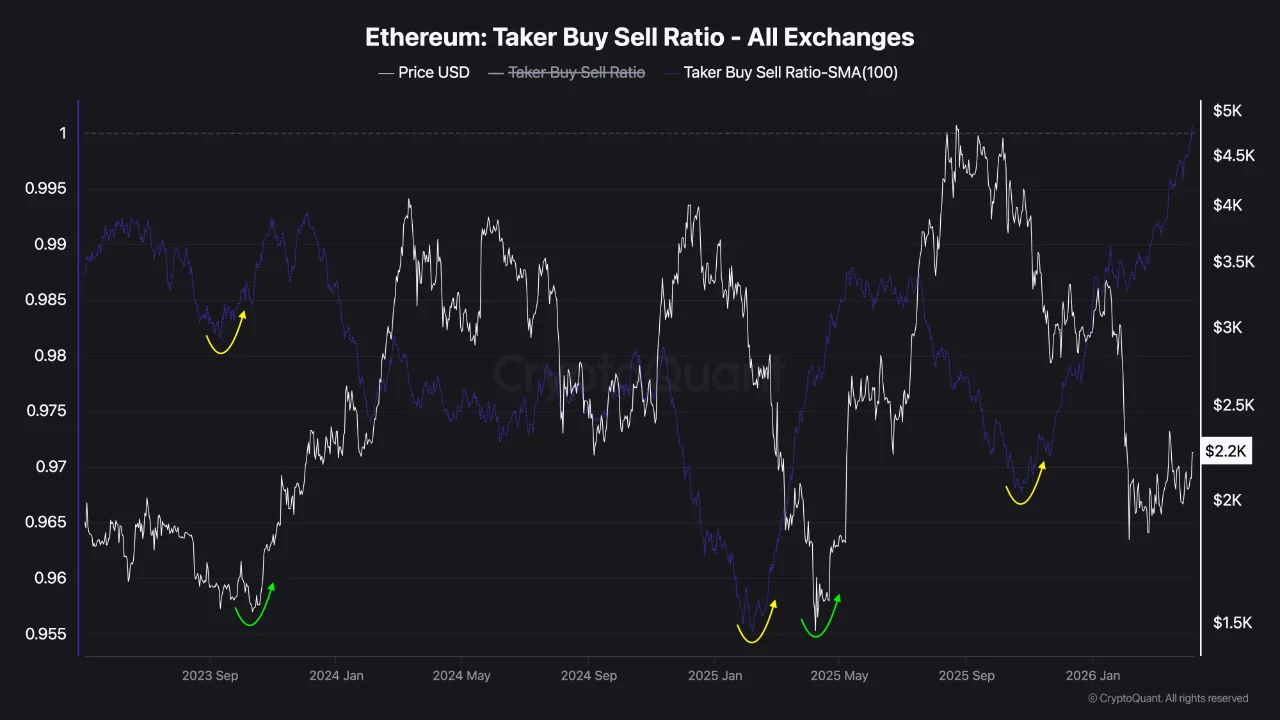
The taker buy/sell ratio across all exchanges, shared by CryptoQuant, had been rising for four to five months before the ceasefire arrived, market orders skewing structurally toward buyers in a way that closely resembles the configuration that preceded the April–May 2025 rally. That prior setup resolved with a significant move higher. The pattern predates the geopolitical trigger entirely. The ceasefire did not create the buyer pressure. It released it.
On Binance flow data, ETH was already in a cleaner position than Bitcoin heading into the move. BTC netflows are positive and the reserve ratio trending upward, a large inflow of coins relative to reserves that typically signals holders preparing to sell into strength. ETH netflows were slightly negative, the reserve ratio near zero, supply close to equilibrium. Bitcoin was carrying the heavier overhead. ETH was not.
That was the setup. Here is what the setup was missing.
The Institutions Were Gone Before the Spike
Spot exchange reserves have fallen to 7.41 million ETH. Derivative exchange reserves sit at roughly the same level. Both contracted simultaneously, the kind of broad drawdown that in a healthy market thins available inventory and forces price discovery higher.

Ethereum has not responded that way, and the reason shows up in the CME options data. Open interest built aggressively during the August–October 2025 window, total exposure exceeding $100 million across multiple maturities.
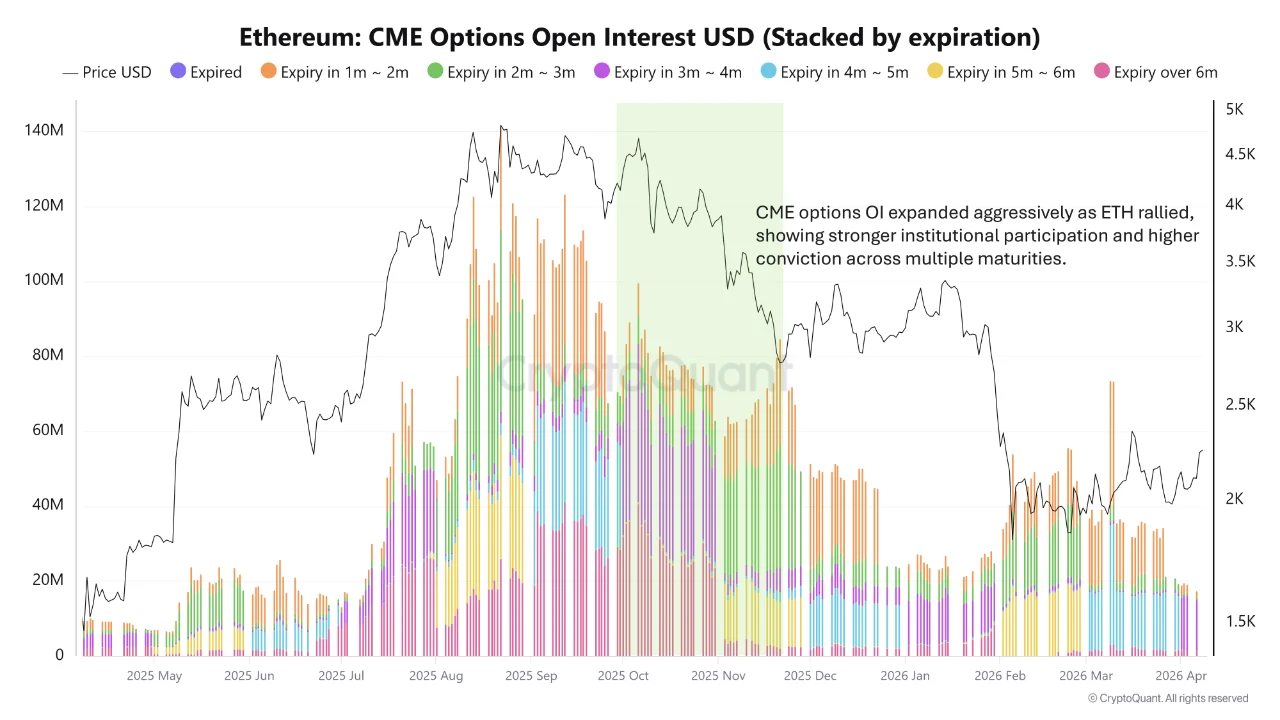
Institutions were layering conviction across the curve, not just near-dated hedges but longer-dated positioning that signals genuine medium-term commitment. Since then the structure has collapsed. Near-dated exposure remains. The longer-dated stack is visibly thinner. The money that holds optionality six months out stepped back months ago and has not returned.
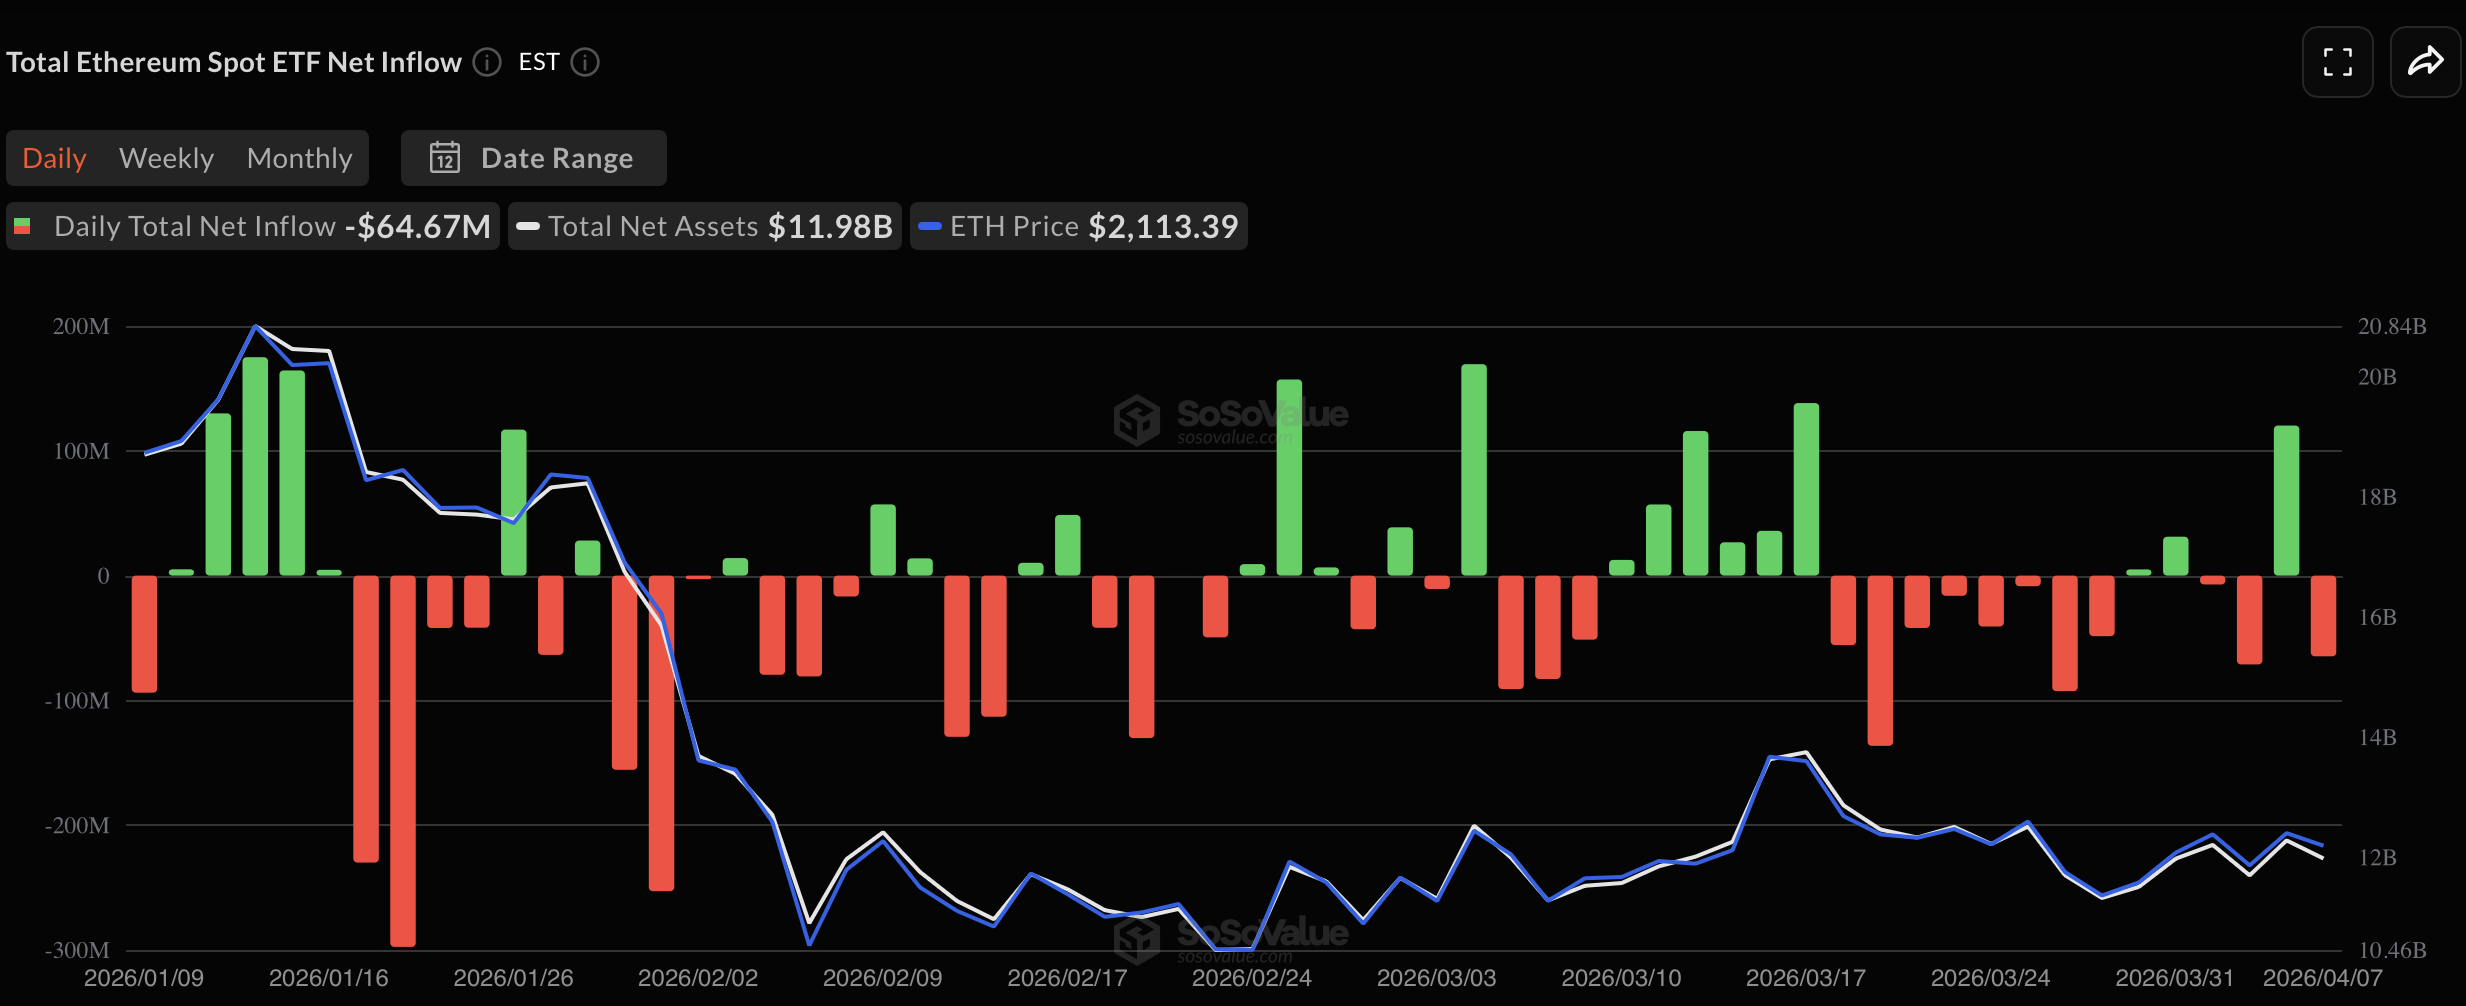
The spot ETF data from SoSoValue confirms the same exit through a different door. Total net assets fell from a January peak of $20.84 billion to $11.98 billion today, nearly halved in three months. The last day saw $64.67 million in net outflows. The pattern since late January has been consistent: brief inflow windows followed by heavier redemptions. The large green bar in early April did not hold. Outflows resumed the next session.
Reserves are falling because ETH is leaving exchanges. Not because institutions are absorbing it.
The chart read all of this before the ceasefire candle closed.
What the RSI Said
The one-hour RSI collapsed to 47.63 while the signal line held at 72.16, a divergence that wide means momentum exhausted itself before price confirmed it. The rally from $2,060 to $2,280 was real and volume supported it on the way up. But $2,200 is now resistance, not support, and the 50 SMA at $2,156 is the first level with any structural significance below current price.

The spike ran into the same institutional absence that was suppressing ETH before the news broke. And the ceasefire adds a clock to all of it.
What Happens after 14 Days
The truce is explicitly temporary. Negotiations begin in Islamabad on Friday. Core terms remain unresolved, US sanctions, frozen Iranian assets, the nuclear question, American troop presence in the region. Iran has said its missile programme is not open for discussion. Trump has said he would resume strikes if talks fail. The market traded the headline. It has not priced day 15.
If Islamabad produces early signs of a durable agreement and the taker ratio pattern continues building, the $2,156 SMA holds as a floor and a reclaim of $2,200 on volume, not a wick, opens the structure toward the 2025 analog’s resolution.
But the weight of the evidence sits elsewhere. CME conviction retreated before the ceasefire. ETF outflows resumed after a single green session. The RSI already gave back the overbought reading that drove the spike. The buyers the taker ratio identified showed up. The holders with six-month conviction did not. Until that changes, $2,200 is a ceiling the ceasefire alone cannot break, and in 14 days, the ceasefire itself needs a new answer.
The information provided in this article is for educational purposes only and does not constitute financial, investment, or trading advice. Coindoo.com does not endorse or recommend any specific investment strategy or cryptocurrency. Always conduct your own research and consult with a licensed financial advisor before making any investment decisions.

Alexander Zdravkov is a person who always looks for the logic behind things. He has more than 3 years of experience in the crypto space, where he skillfully identifies new trends in the world of digital currencies. Whether providing in-depth analysis or daily reports on all topics, his deep understanding and enthusiasm for what he does make him a valuable member of the team.