Crypto Outlook Weakens as ETF Outflows and Participation Decline

Crypto markets are showing signs of weakening momentum as institutional outflows accelerate and on-chain activity continues to decline.
Key Takeaways:
- Bitcoin ETFs recorded $225.5 million in net outflows on March 27, led by BlackRock’s IBIT.
- Ethereum ETFs extended losses with $48.5 million in outflows.
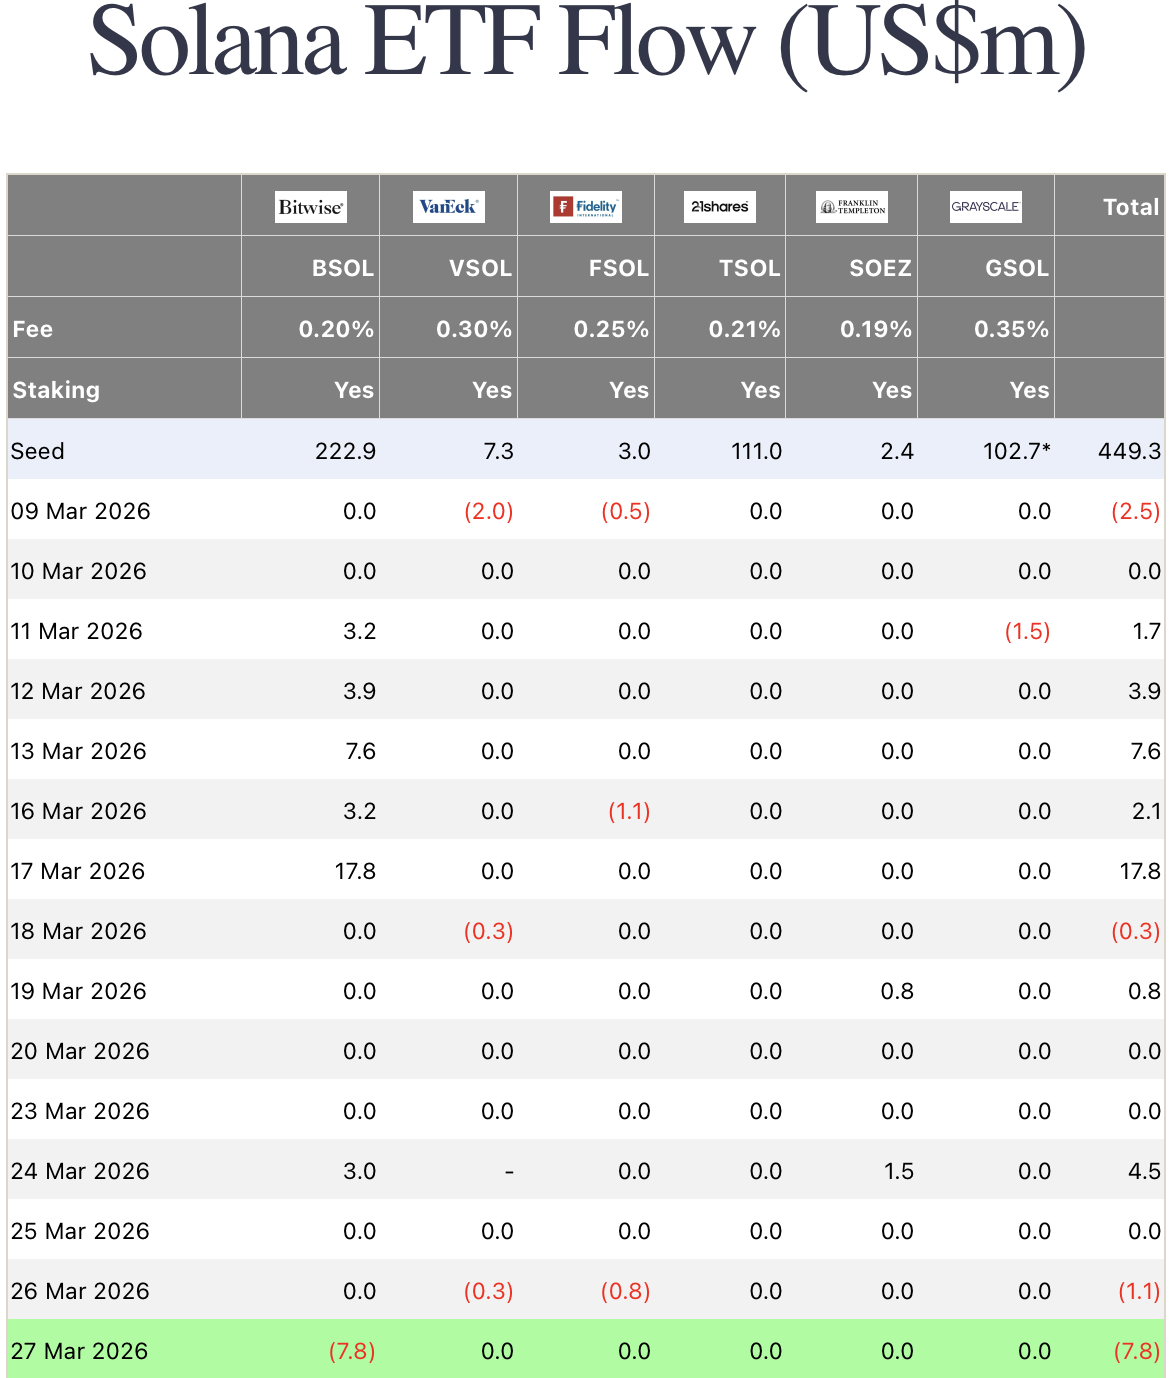
- Solana ETF flows remained muted with $7.8 million in net outflows.
- Bitcoin active addresses have declined more than 30% since August 2025.
Bitcoin ETF Outflows Deepen
Data from Farside Investors shows that Bitcoin ETFs posted negative results on March 27, with total net outflows reaching $225.5 million. The majority of the selling pressure came from BlackRock’s IBIT, which alone recorded $201.5 million in outflows, reinforcing its role as the primary driver of institutional positioning.
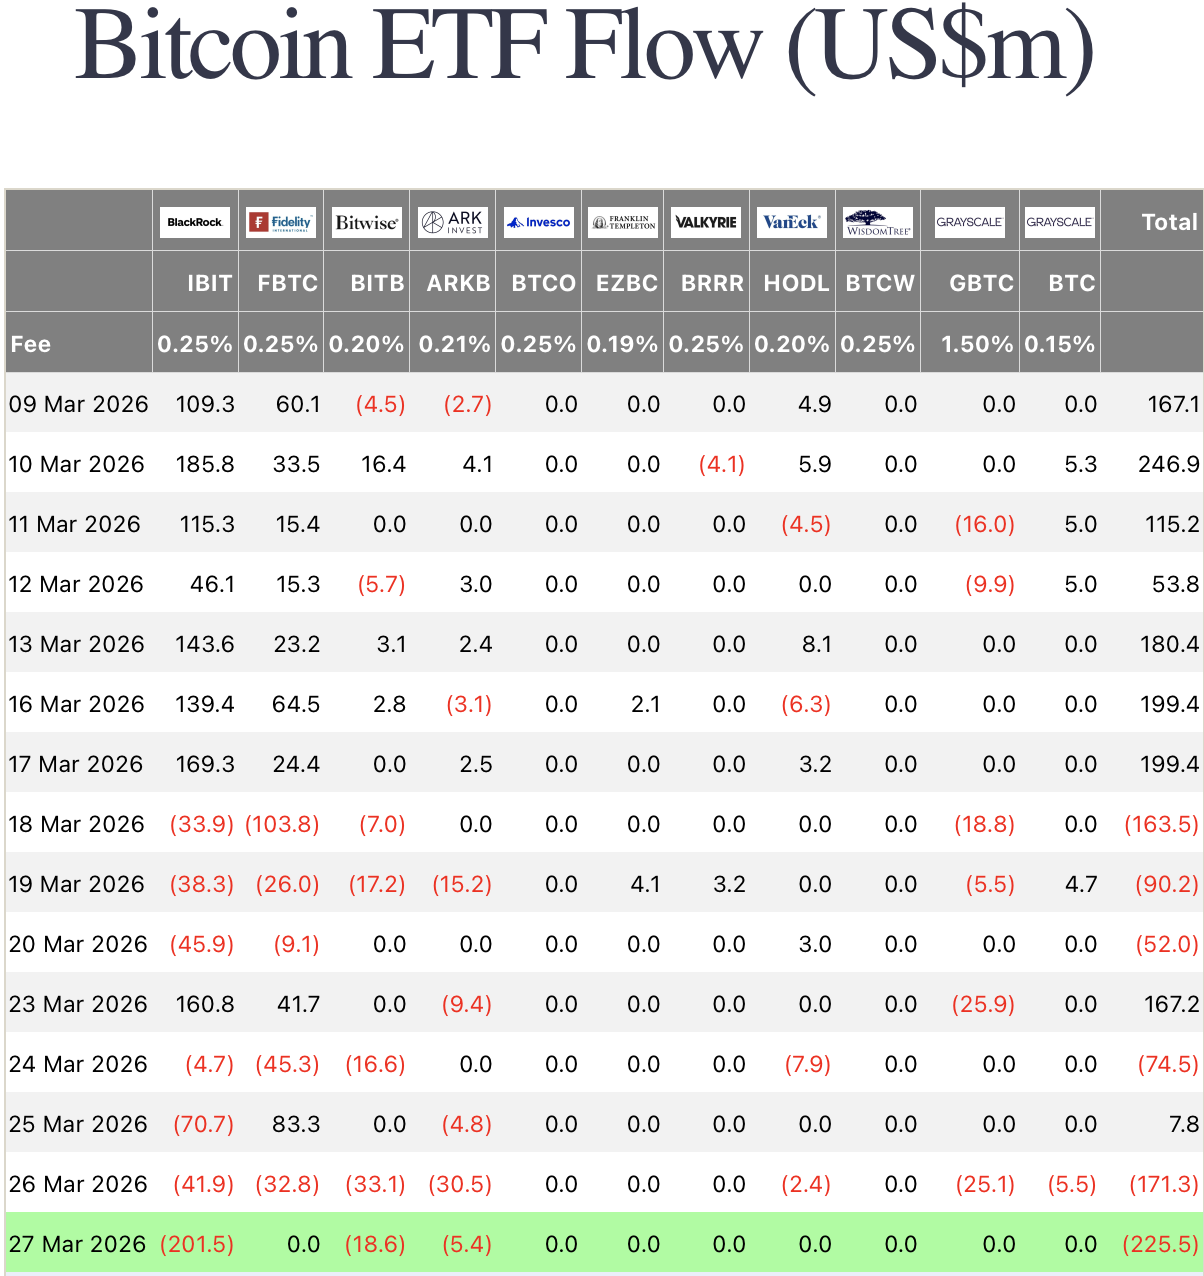
Additional outflows were observed across Bitwise and ARK products, suggesting that the move was not isolated but reflected broader institutional de-risking. The scale and concentration of selling point to capital reduction rather than rotation, indicating a more defensive stance among large investors.
Ethereum ETFs Extend Weakness
Ethereum ETFs continued to lag, registering $48.5 million in net outflows and extending their recent negative trend. While select funds such as BlackRock’s ETHB and Fidelity’s FETH saw inflows, these were outweighed by broader selling across the segment.
The divergence between funds highlights selective positioning rather than renewed demand, with Ethereum still struggling to attract consistent institutional flows compared to Bitcoin.
Solana and XRP ETF Activity Remains Limited
Solana ETF products recorded modest outflows of $7.8 million, reflecting subdued activity following earlier interest. The lack of meaningful inflows suggests that institutional engagement with altcoin ETFs remains cautious.
According to information from Coinglass XRP-linked ETF products showed no net flows on the day, reinforcing a wait-and-see approach among investors toward smaller-cap crypto exposure. The absence of capital rotation into these assets further supports the broader risk-off narrative.

Bitcoin Network Activity Signals Structural Slowdown
Beyond ETF flows, on-chain data shared by CryptoQuant reveals a deeper cooling in Bitcoin’s underlying activity. Active addresses have declined from 938,609 in August 2025 to 655,908 by March 25, 2026 – a drop of 30.12%.
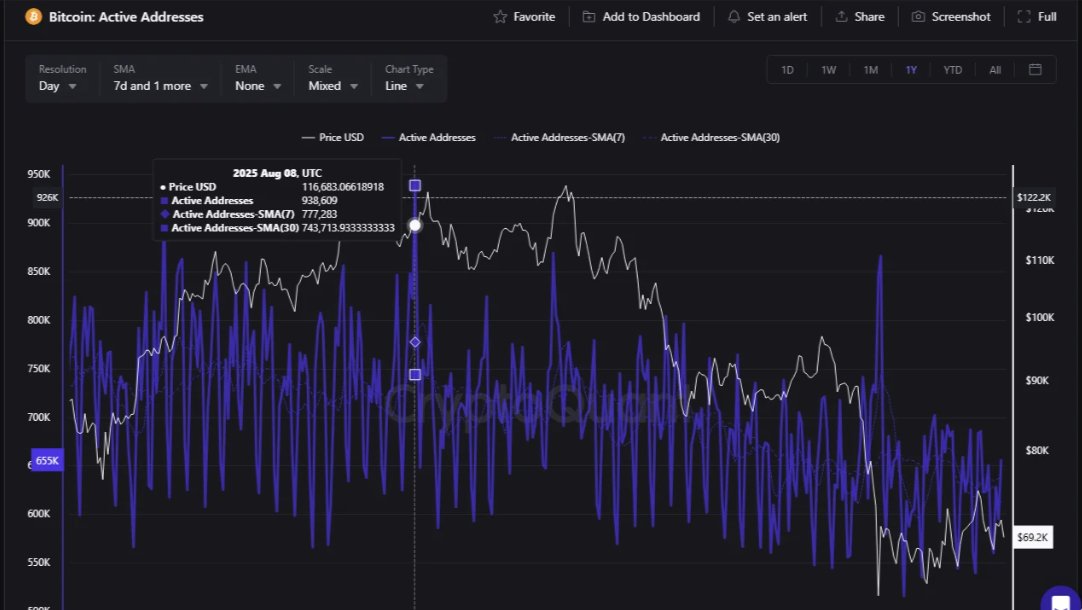
The trend is consistent across moving averages, with the 7-day average down 21.14% and the 30-day average declining 14.44%. This indicates a sustained reduction in network participation rather than short-term volatility.
Adding to this weakness, Glassnode data shows Bitcoin’s accumulation trend score approaching zero – a signal typically associated with large holders distributing rather than accumulating. Historically, such conditions reflect reduced conviction among whales, often coinciding with periods of consolidation or downside pressure.
Falling activity combined with distribution suggests weaker transaction volume, reduced capital rotation and lower organic demand – all of which are critical for supporting long-term market strength.
Technical Analysis: Bitcoin (BTC)
Recent price action shows Bitcoin stabilizing around the $66,400 level after a sharp intraday sell-off from the $68,000+ range. The move suggests short-term capitulation followed by consolidation, with price now forming a narrow range between approximately $65,500 support and $66,800 resistance.
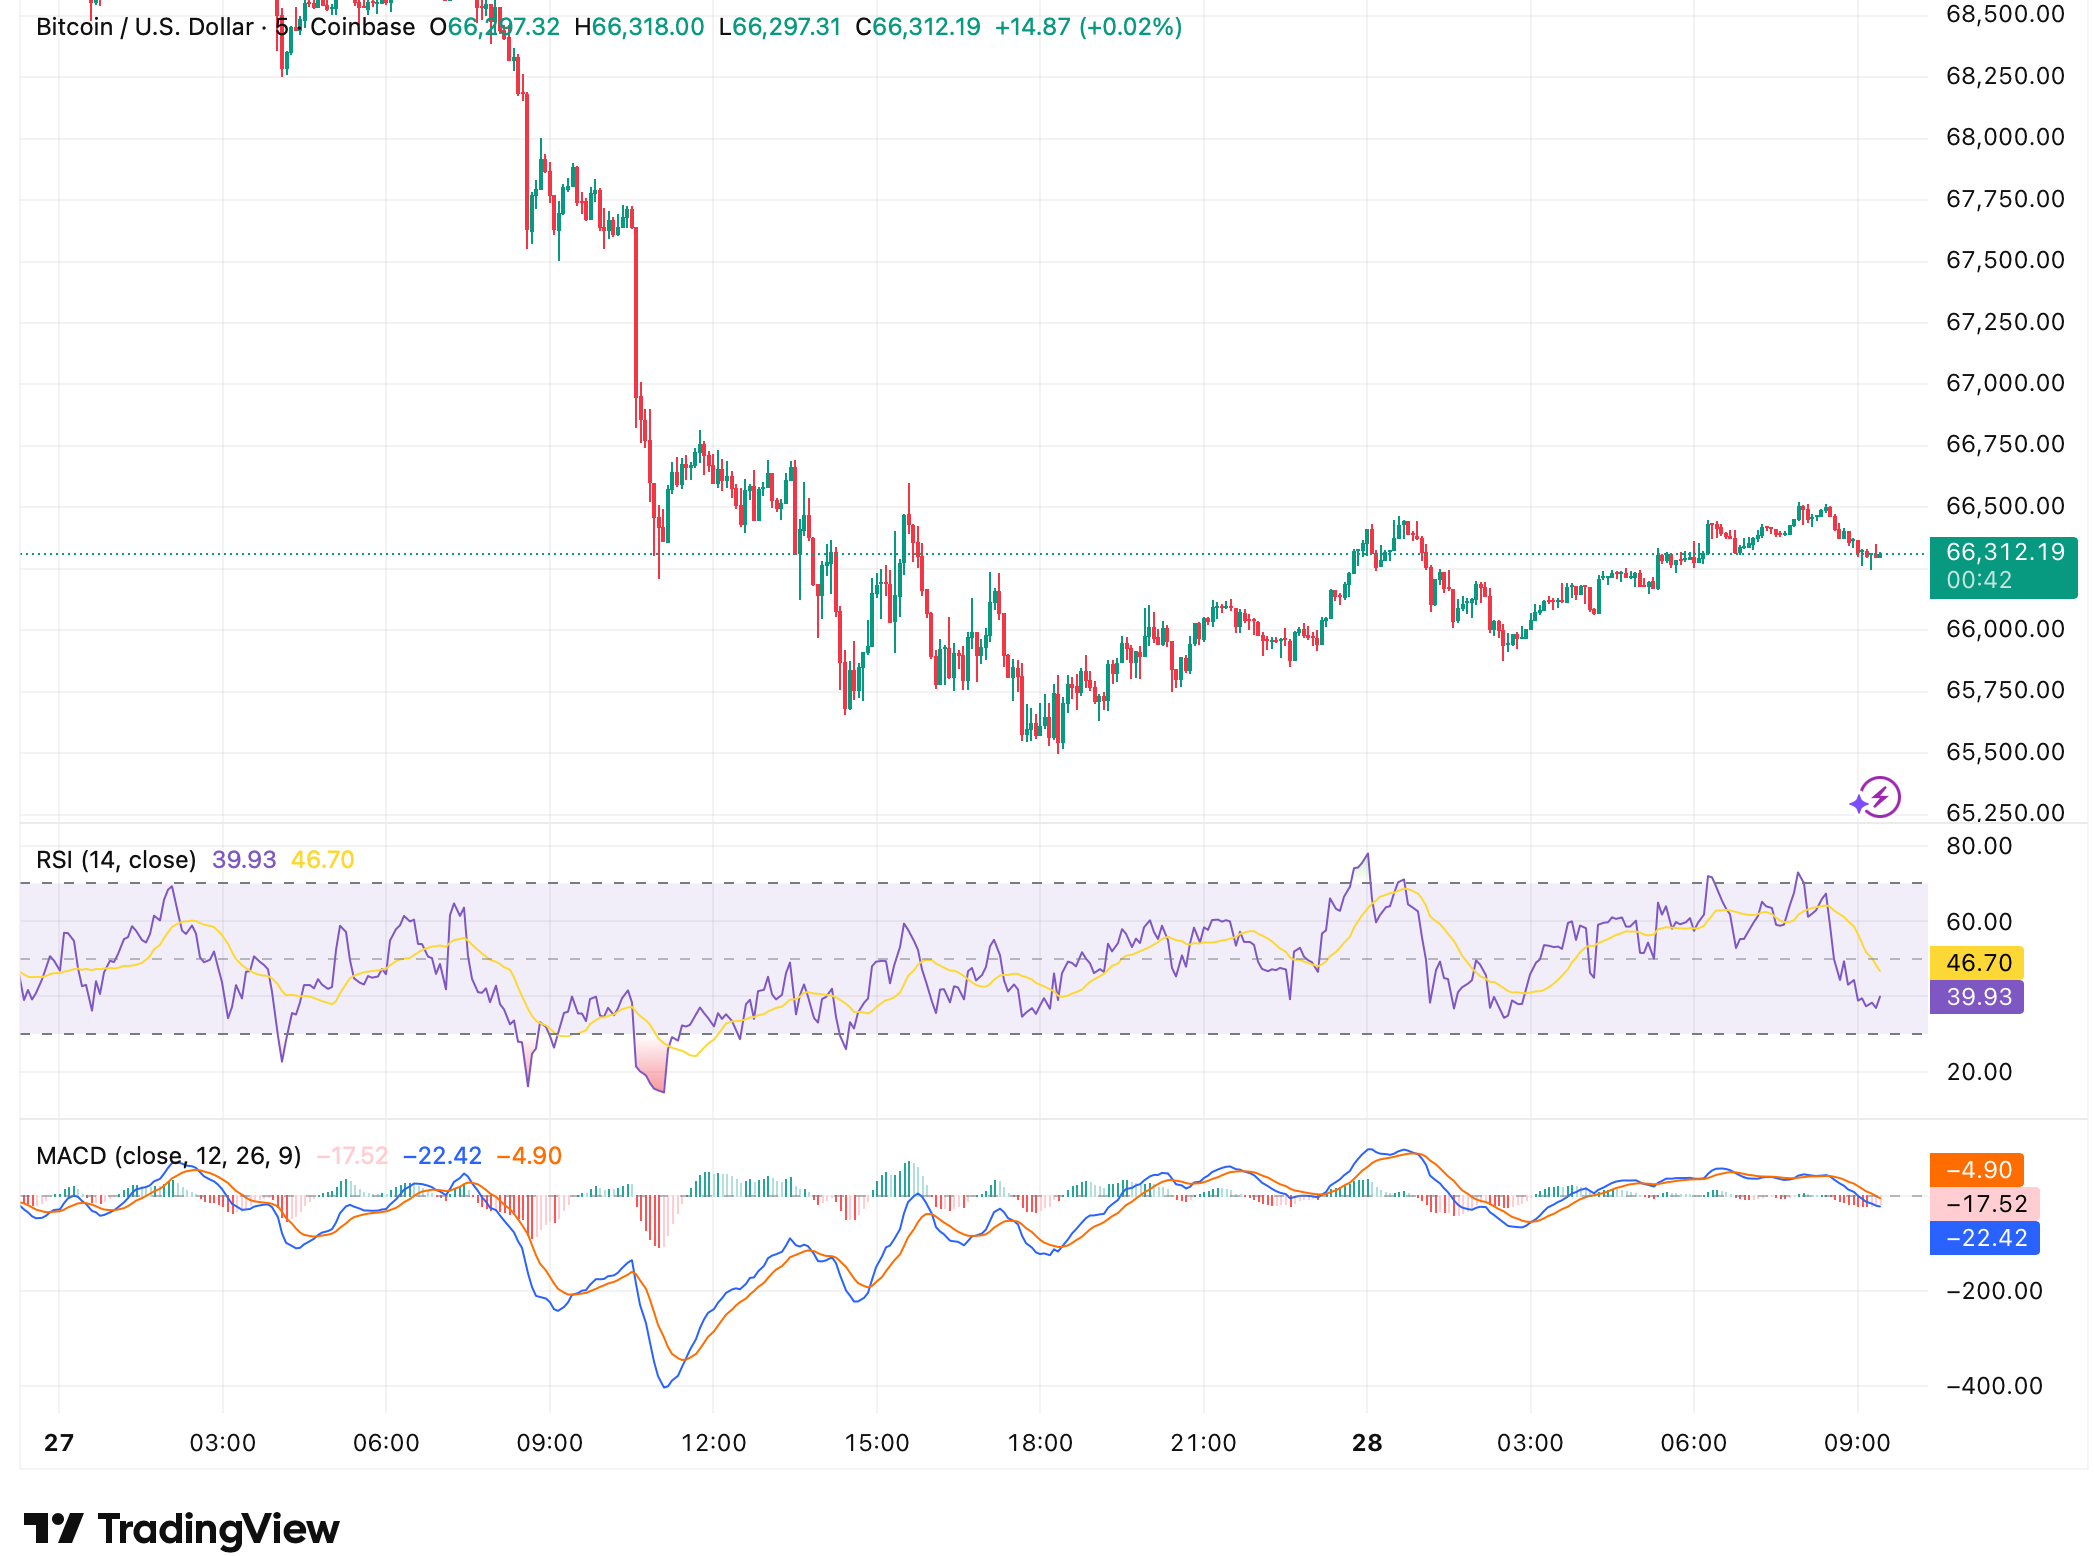
Momentum indicators reflect a weakening structure. The Relative Strength Index (RSI) remains below the midline, hovering around the 40–47 range, indicating subdued buying strength. Meanwhile, the MACD remains in negative territory, with the signal line still below zero – pointing to lingering bearish momentum despite the recent stabilization.
This setup suggests Bitcoin is in a consolidation phase following a corrective move, with upside limited unless momentum indicators recover. A break below the $65,500 zone could expose further downside, while reclaiming $67,000 would be needed to shift short-term sentiment.
Technical Analysis: Ethereum (ETH)
Ethereum is showing a similar but slightly more stable structure, trading near the $1,995–$2,000 range after recovering from a sharp drop below $2,000. Price action indicates a sideways consolidation, with resistance forming near $2,010 and support around $1,970.
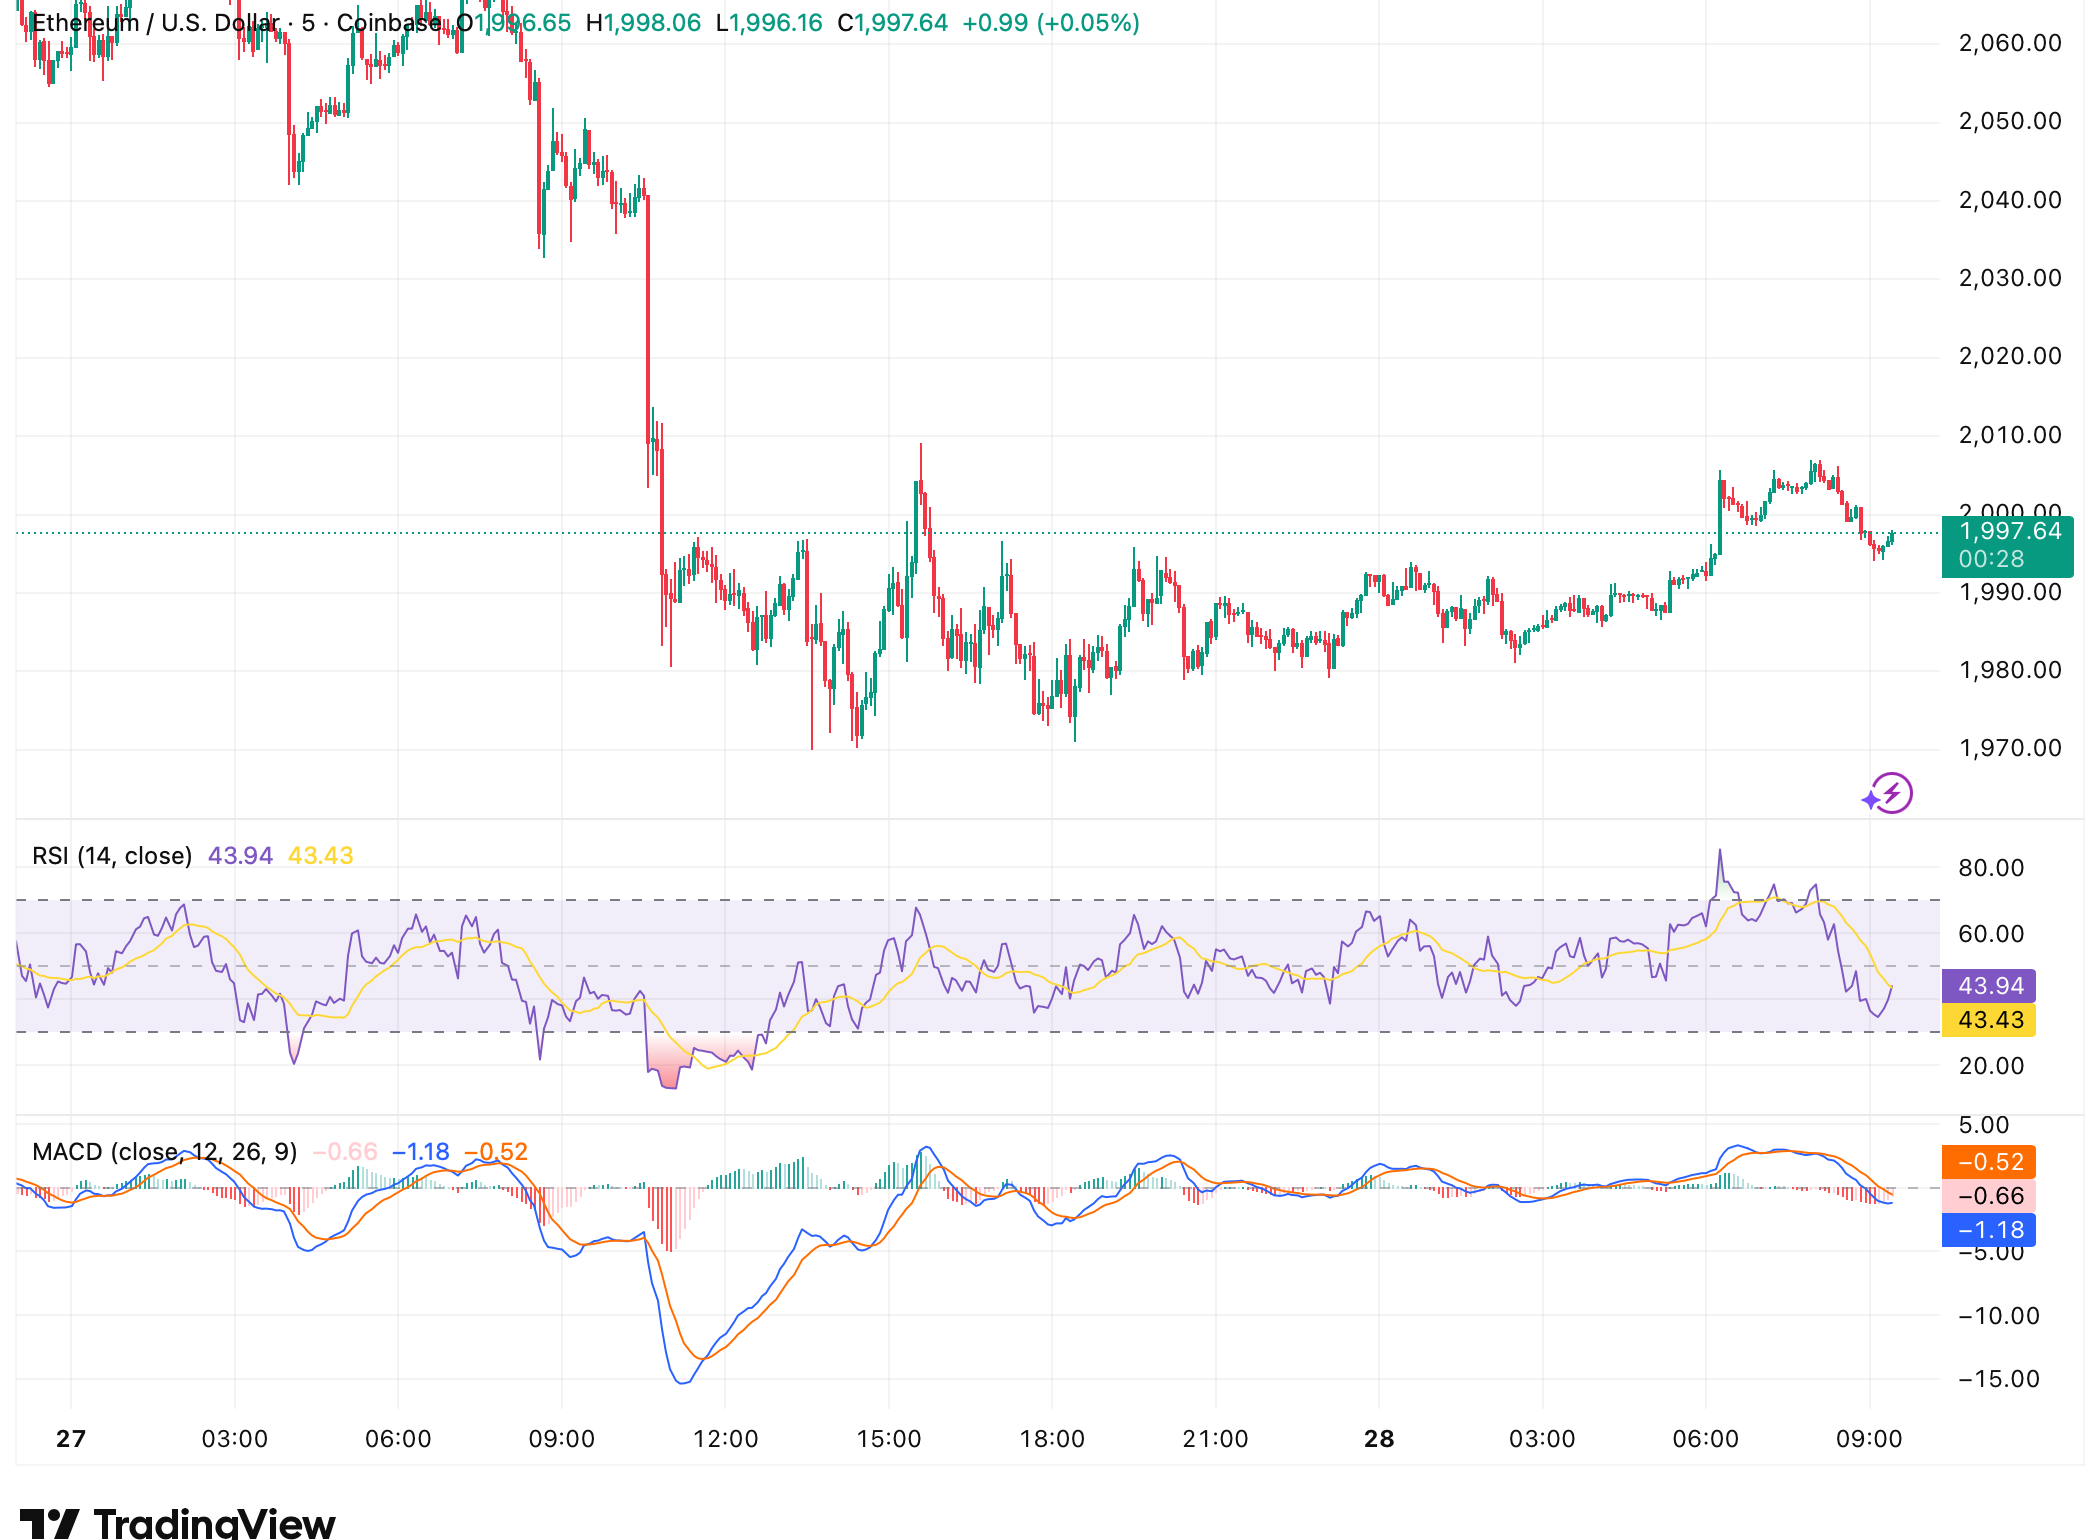
RSI is hovering in the low-to-mid 40s, reflecting neutral-to-weak momentum without clear directional strength. The MACD remains slightly negative but is flattening, suggesting that selling pressure may be easing, though not yet reversing.
Compared to Bitcoin, Ethereum appears less volatile in the short term but still lacks strong bullish momentum. The current structure points to a range-bound market, with a breakout above $2,020 needed to signal recovery, while a drop below $1,970 could reintroduce downside risk.
Market Participation Narrows as Risk Appetite Fades
The combination of ETF outflows and declining network activity points to a market that is losing both capital and participation. While institutional products remain a key driver of price dynamics, their influence appears increasingly detached from underlying usage metrics.

This divergence suggests that recent market behavior is being shaped more by positioning and liquidity than by organic growth.
As participation narrows, price movements may become more volatile and sensitive to external catalysts.
Conclusion: Market Weakness Extends Beyond Price
The latest data underscores a broader shift in crypto market conditions, where institutional flows, on-chain activity and whale behavior are all pointing in the same direction.
Bitcoin’s decline in active addresses highlights weakening engagement, while the near-zero accumulation trend score suggests that large holders are stepping back. Combined with ETF outflows, these signals indicate a market that lacks strong structural support.
Until participation strengthens and accumulation returns, any recovery is likely to remain fragile – leaving the market in a transitional phase defined more by caution than sustained growth.
The information provided in this article is for educational purposes only and does not constitute financial, investment, or trading advice. Coindoo.com does not endorse or recommend any specific investment strategy or cryptocurrency. Always conduct your own research and consult with a licensed financial advisor before making any investment decisions.

Alexander Zdravkov is a person who always looks for the logic behind things. He has more than 3 years of experience in the crypto space, where he skillfully identifies new trends in the world of digital currencies. Whether providing in-depth analysis or daily reports on all topics, his deep understanding and enthusiasm for what he does make him a valuable member of the team.