Bitcoin Ends March Under Pressure as Derivatives Flash Warning Sign

Bitcoin is closing with one if its worst performance in months as derivatives signal growing short exposure and a long-term capitulation metric enters historic bottom territory for the fourth time ever.
Key Takeaways
- BTC at $66,746 on March 31 close, below 50 SMA.
- Binance CVD reverses $1.4 billion from buy-side to sell-side.
- OI surge on March 27 driven by short exposure, not bullish demand.
- Van de Poppe expects early April low sweep before recovery.
- LTH SOPR at 0.8 – fourth historical instance preceding major bottoms.
What the Price Chart Shows
According to the one-hour TradingView chart, Bitcoin opened March 26 above $71,000 and sold off sharply through March 27, reaching lows near $65,000 with the RSI bottoming near 20. The recovery from that low pushed price back to $68,500 by March 30 before rolling over again on March 31, dropping to $66,000 before partially recovering to $66,746.
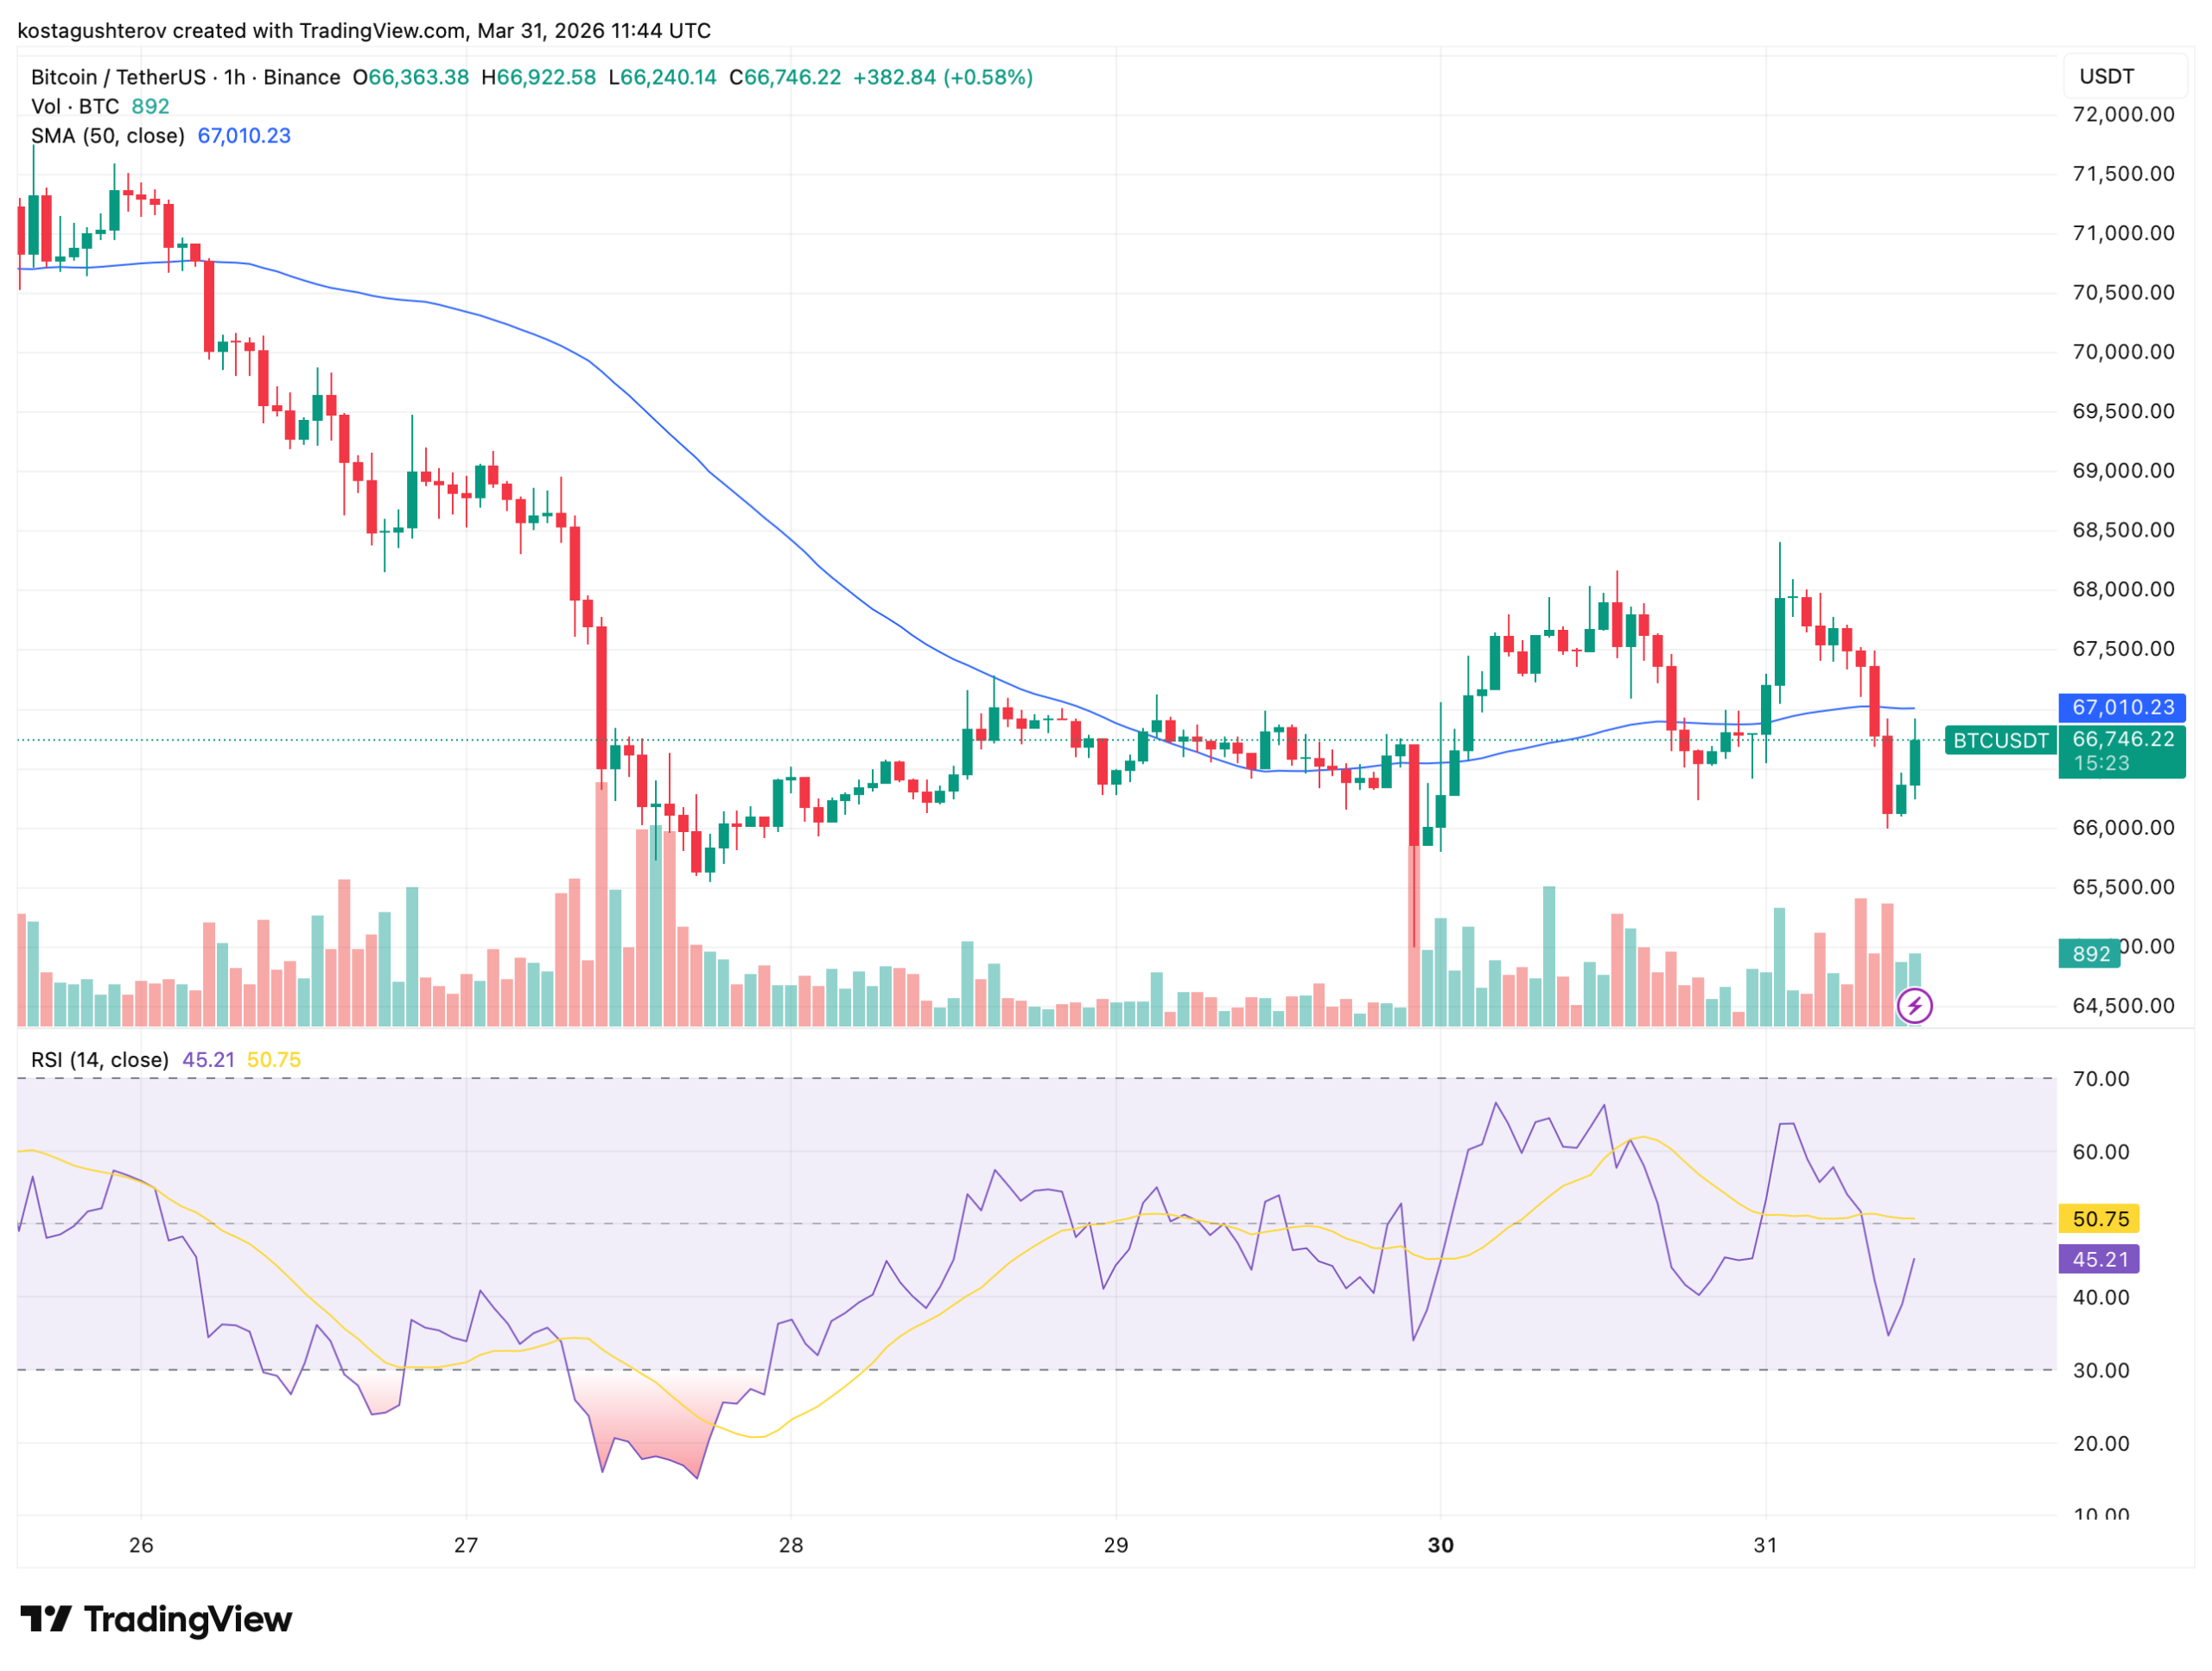
The 50-period simple moving average sits at $67,010, above current price and beginning to flatten after weeks of declining. The RSI reads 45.21 against a smoothed signal at 50.75, below its own average in neutral territory. The pattern visible across the week is more telling than any single indicator: every bounce has been sold before price could reclaim the moving average. The derivatives market is where that selling is coming from.
What the Derivatives Are Showing
Between March 25 and March 31, the Binance Cumulative Volume Delta dropped from approximately $1.02 billion to -$398 million, according to CryptoQuant data. That is a net swing of approximately $1.4 billion from aggressive buy-side activity to persistent sell-side pressure in less than a week. The reversal happened as the price recovery was building, meaning sellers were absorbing the buying in real time rather than following it after the fact.
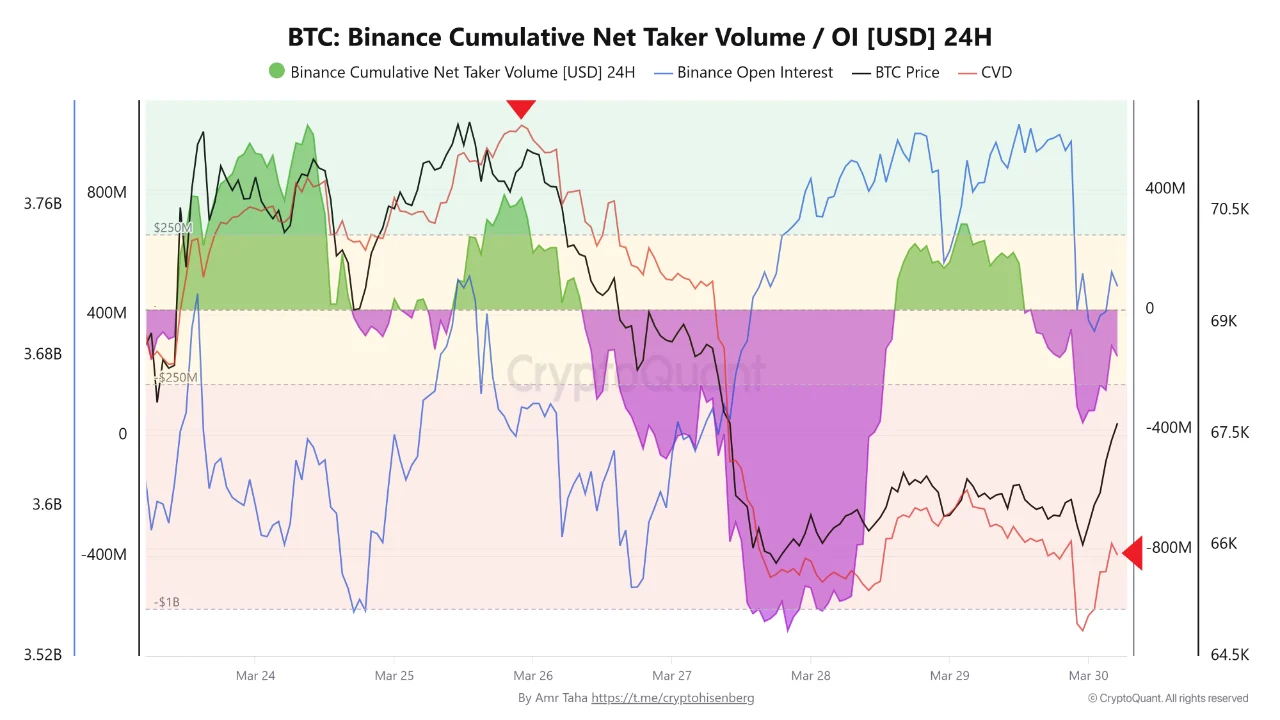
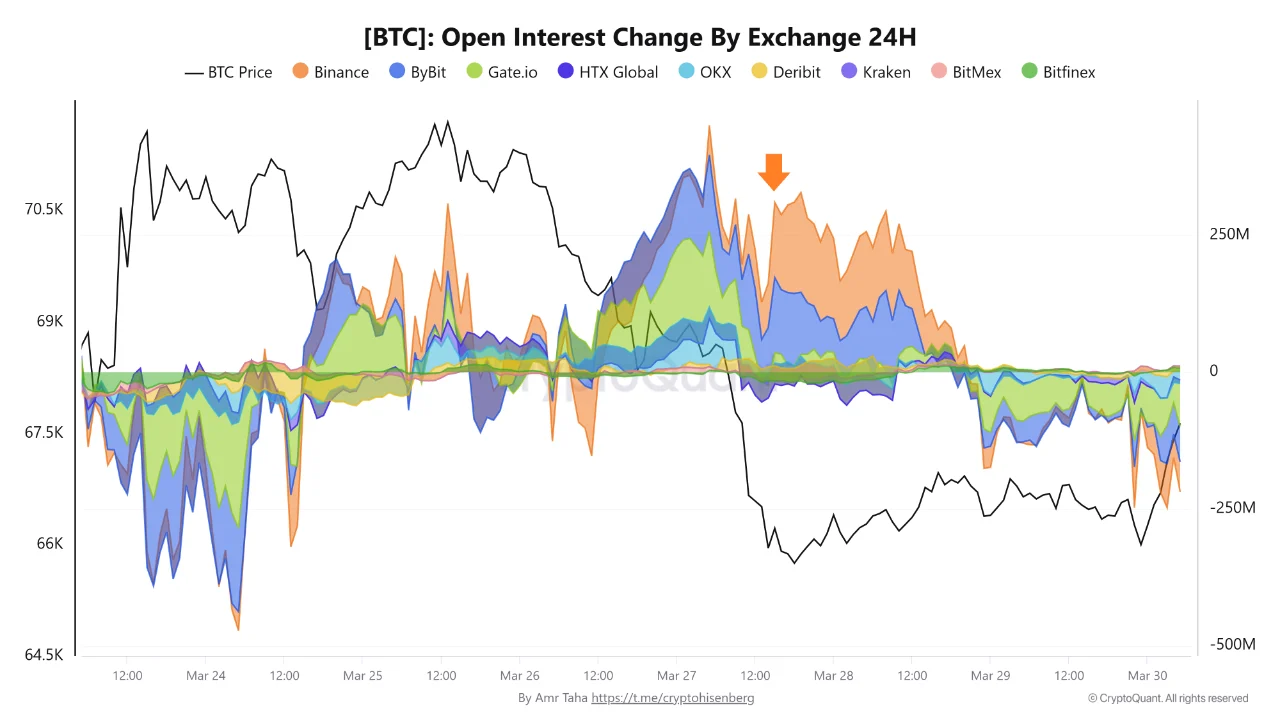
On March 27, Open Interest on both Binance and Bybit surged simultaneously, with each exchange adding approximately $137 million while Bitcoin was trading near $66,200. Rising open interest alongside deteriorating CVD points to one conclusion: the newly added leverage was not coming from buyers. It was coming from short exposure. New positions were being opened against the recovery, not alongside it.
The liquidation map makes the consequence of that positioning specific. A large share of visible liquidation levels sits above the current price. That cluster represents the short positions that would be forced to close if Bitcoin moves higher, the fuel for a potential short squeeze sitting directly above the market. For now it is evidence of who controls the derivatives market. Whether it becomes a squeeze trigger depends on what happens to price in early April.
That is precisely where van de Poppe’s analysis is focused.
What Van de Poppe Is Watching
Michaël van de Poppe posted on March 31 that the question for Bitcoin is no longer whether the price falls further but when. Every bounce upward has been rejected, the trend remains downward, and his expectation is that early April brings a sweep of the current lows to clear liquidity before a sustainable recovery can begin. The short positioning visible in the derivatives data is consistent with that setup, shorts building above price while bounces are sold is the market structure that typically precedes a liquidity sweep rather than a recovery.
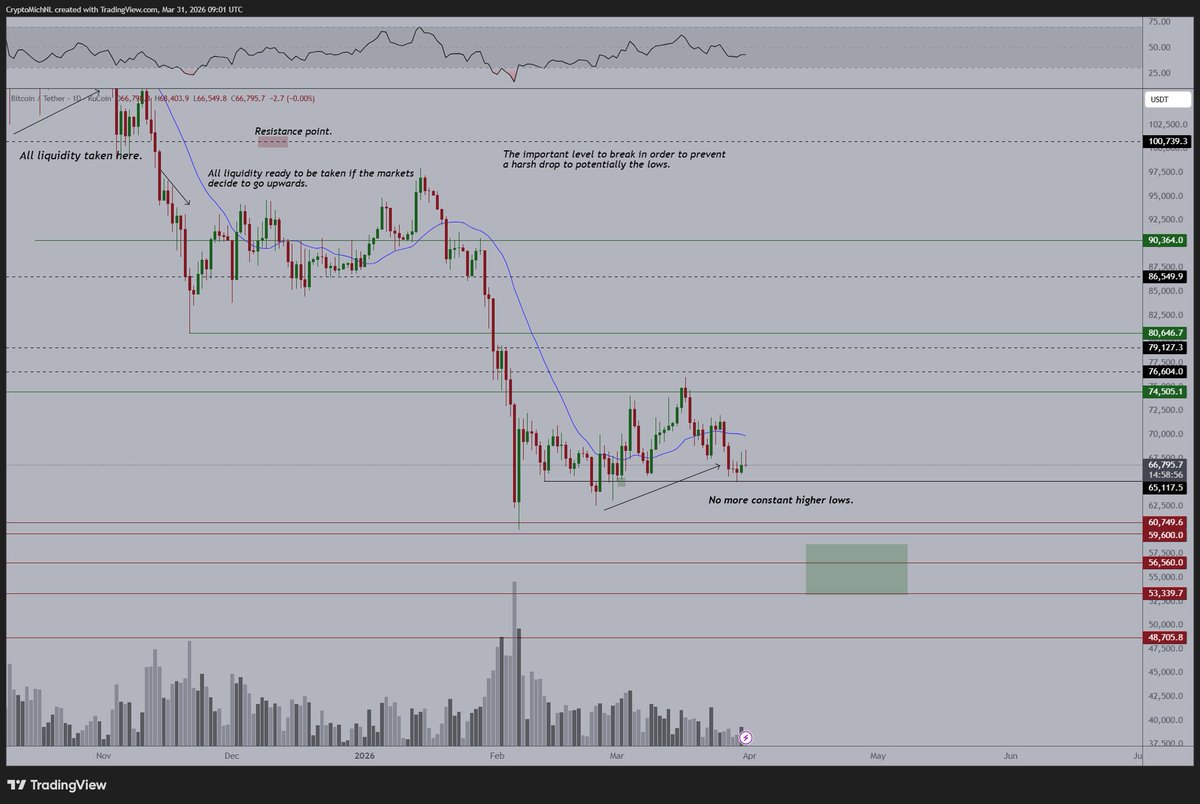
The key level van de Poppe identifies as critical is approximately $74,505, the level that needs to break to the upside to prevent a deeper decline. Below current price, the support zones stack at $65,117, then $60,749 to $59,600, then $56,560, with deeper support at $51,339 to $48,705 if those zones fail. The early April sweep scenario targets $65,117 as the liquidity pool the market needs to clear before turning.
If that sweep happens, if Bitcoin flushes toward $65,000 or below in early April, it would occur at exactly the level the long-term on-chain data identifies as historically significant.
What the LTH SOPR Is Signalling
The Long-Term Holder Spent Output Profit Ratio, tracked on CryptoQuant, currently reads 0.8. A reading below 1 means long-term holders are selling their Bitcoin at a loss. Long-term holders are the cohort least sensitive to short-term volatility, they hold through corrections that shake out retail participants. When they begin realising losses, it signals that the stress has reached a level where even the most conviction-driven participants are capitulating.
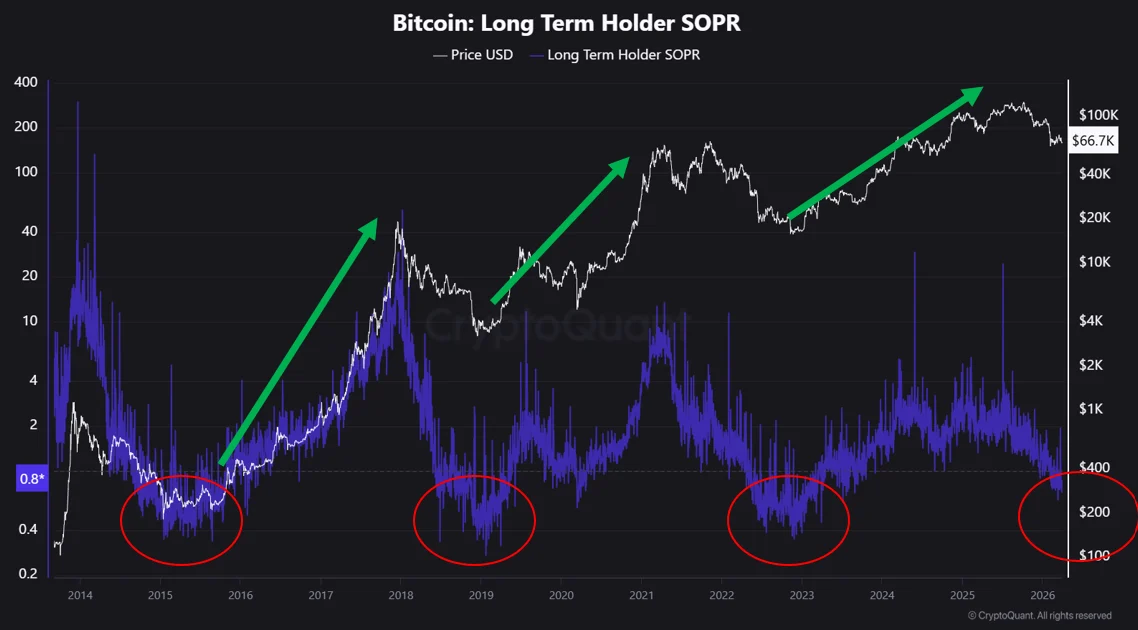
By the time LTH SOPR drops below 1, short-term holders have typically already exited or absorbed significant losses. The majority of market participants are operating at a loss simultaneously, a condition where selling pressure gradually exhausts itself because the sellers willing to take losses have largely already sold.
The CryptoQuant chart marks four instances where LTH SOPR dropped to this zone: 2015, 2018/19, 2022/23, and now in 2026. Each prior instance was followed by a significant price recovery. The current 0.8 reading places this moment in the same historical category as those three prior bottoms. It does not confirm today is the low. It confirms the market is inside the zone where the low has historically formed.
Van de Poppe expects a flush to the lows in early April. The LTH SOPR says that if the flush happens, it will happen at the kind of long-term capitulation level that has preceded every major Bitcoin recovery on record.
What This Means for the Close of March
The LTH SOPR at 0.8 and the historical pattern it mirrors are compelling. Three prior instances all preceded major recoveries, that is not a coincidence, it is a structural argument. The contra-thesis is equally specific: historical patterns do not fire on a fixed schedule, and a market where the Federal Reserve has flipped from rate cuts to rate hikes is a different macro environment than the ones that surrounded the 2015, 2019, and 2022 bottoms. The SOPR identifies the condition. It does not control the timeline.
What the derivatives data adds to that is more immediate. The $1.4 billion CVD reversal and the short positions clustering above price describe a market where sellers are not exhausted — they are organised. Van de Poppe’s early April sweep scenario is the near-term version of what the SOPR is describing at the long-term level: a final flush that clears the leverage before the structure can reverse.
The most likely path through all of this data is not a clean bottom forming quietly at current levels. It is a sharper move lower that triggers the short squeeze fuel sitting in the liquidation map above price, clears the remaining long-term holder capitulation, and creates the asymmetric entry the SOPR has historically preceded. That sequence is not guaranteed. But it is the scenario where every piece of data in this picture resolves in the same direction at the same time.
Bitcoin at $66,700 looks like it’s not the bottom, but it may be one move away from it.
The information provided in this article is for educational purposes only and does not constitute financial, investment, or trading advice. Coindoo.com does not endorse or recommend any specific investment strategy or cryptocurrency. Always conduct your own research and consult with a licensed financial advisor before making any investment decisions.

Kosta joined the team in 2021 and quickly established himself with his thirst for knowledge, incredible dedication, and analytical thinking. He not only covers a wide range of current topics, but also writes excellent reviews, PR articles, and educational materials. His articles are also quoted by other news agencies.