Altcoin Markets Post Quiet Weekly Gains as Volume Data Tells a Different Story
Most major digital assets closed the week in positive territory, but collapsing trading volumes and a sharp fade from mid-week highs suggest the rally is running on fumes rather than conviction.
Key Takeaways
- XRP led major assets with a 2.98% weekly gain, trading around $1.43, while HYPE and TRON both added over 6%.
- Ethereum closed the week up 1.34% at around $2,133, well below its mid-week high near $2,400.
- Solana was broadly flat on the week at $88.81, having briefly approached $96 on March 17.
- Altcoin trading volumes on Binance have collapsed to roughly $7.7 billion, down from $40 – 50 billion during the October and February 2025 peaks.
- Combined altcoin volume across other major exchanges stands at approximately $18.8 billion, compared to highs near $91 billion.
On the surface, it was a decent week for crypto. XRP gained nearly 3%, Hyperliquid surged 6.47%, TRON quietly climbed 6.12%, and Ethereum added 1.34%. Solana was essentially flat. For anyone tracking weekly closes, the scoreboard looks reasonable — a market holding up, perhaps even grinding higher. Look a little deeper, though, and the picture becomes more complicated. The way these gains were made, and what happened in the days that followed the mid-week peak, raises questions that weekly returns alone cannot answer.
Ethereum: Gains That Mask a Deeper Fade
Ethereum closed the week up 1.34% at around $2,133 – a positive number on paper, but one that tells only part of the story. ETH was the asset with perhaps the most to prove heading into the week, and for a brief moment on March 17 it delivered, climbing toward $2,400 in what looked like a credible attempt to reclaim a key technical level. In the yesterday’s session Ethereum ETFs recorded total net outflows of $136 millions, marking one of the worst days this month.
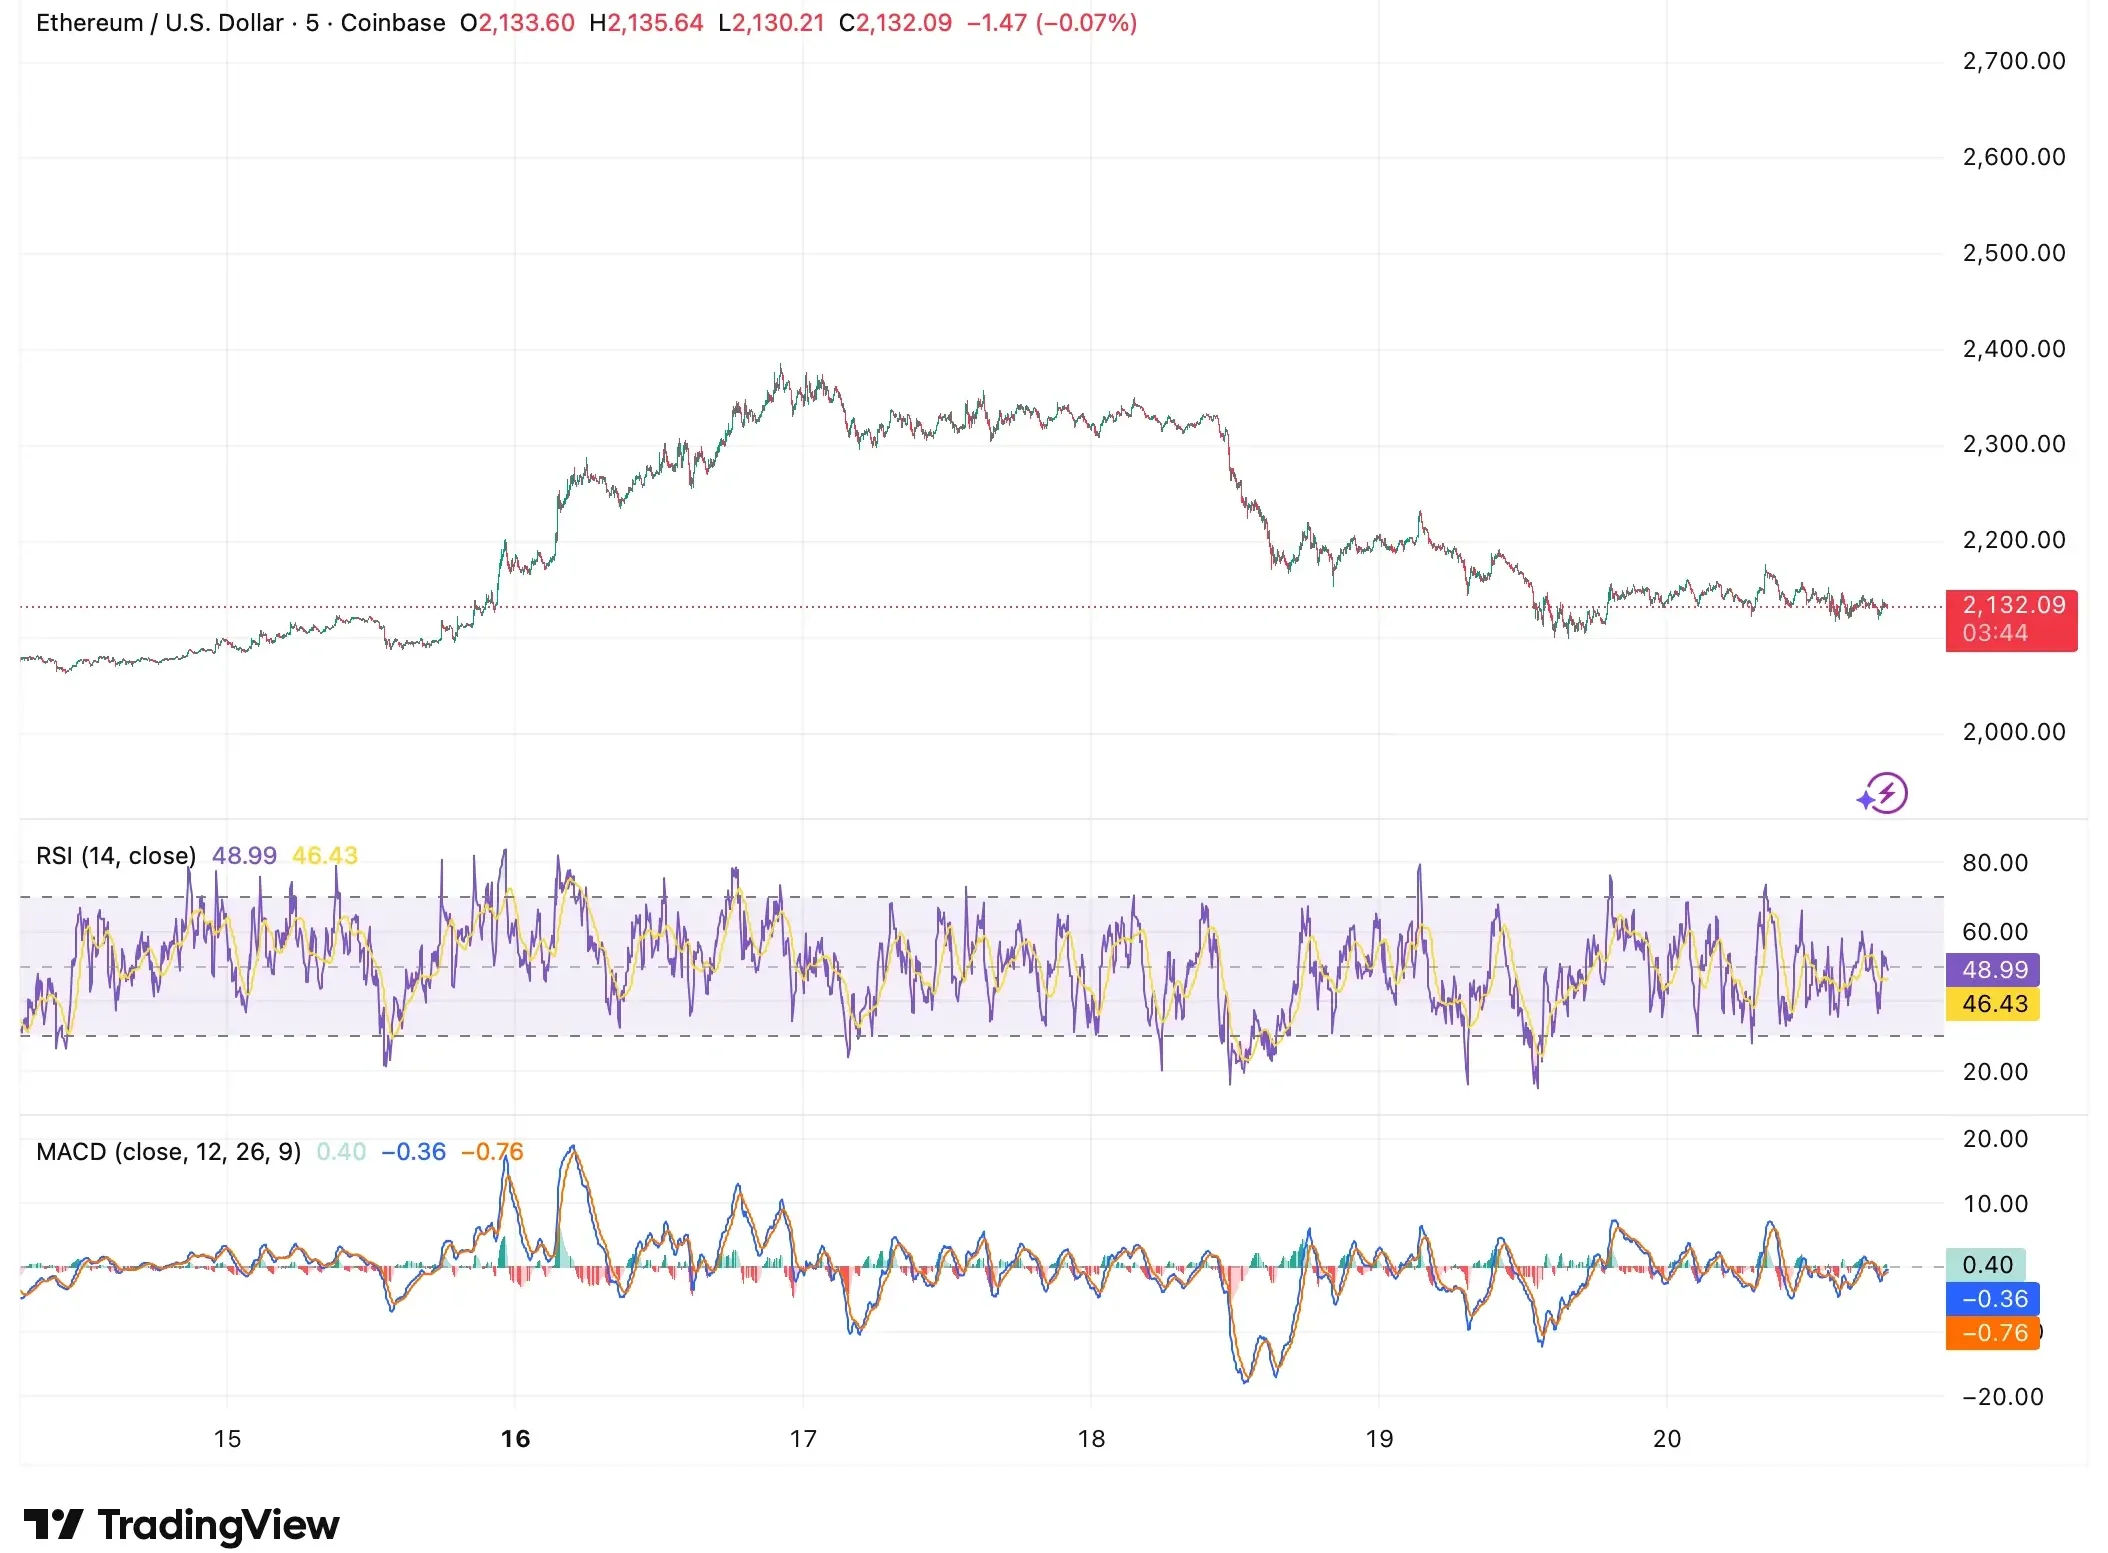
What followed was less convincing. Three days of steady selling brought the price back to where it started, and the RSI sitting at roughly 49 – barely neutral – reflects a market that has lost its sense of direction. The MACD remains in slightly negative territory, suggesting selling pressure has the marginal edge. The $2,100 level is now the floor to watch. A clean break below it would shift the conversation considerably.
XRP: The Week’s Relative Outperformer
XRP made the strongest case for itself. A 2.98% weekly gain to $1.43 is notable not just for the number but for how the asset held up relative to peers during the post-peak fade. XRP ETF’s recorded 0 net inflows in the past 2 market sessions.
Where ETH and SOL gave back the bulk of their mid-week moves, XRP retained more of its gains and is holding above its pre-rally baseline more convincingly. The mid-week run from roughly $1.38 to a brief touch of $1.58 was sharp and clean.
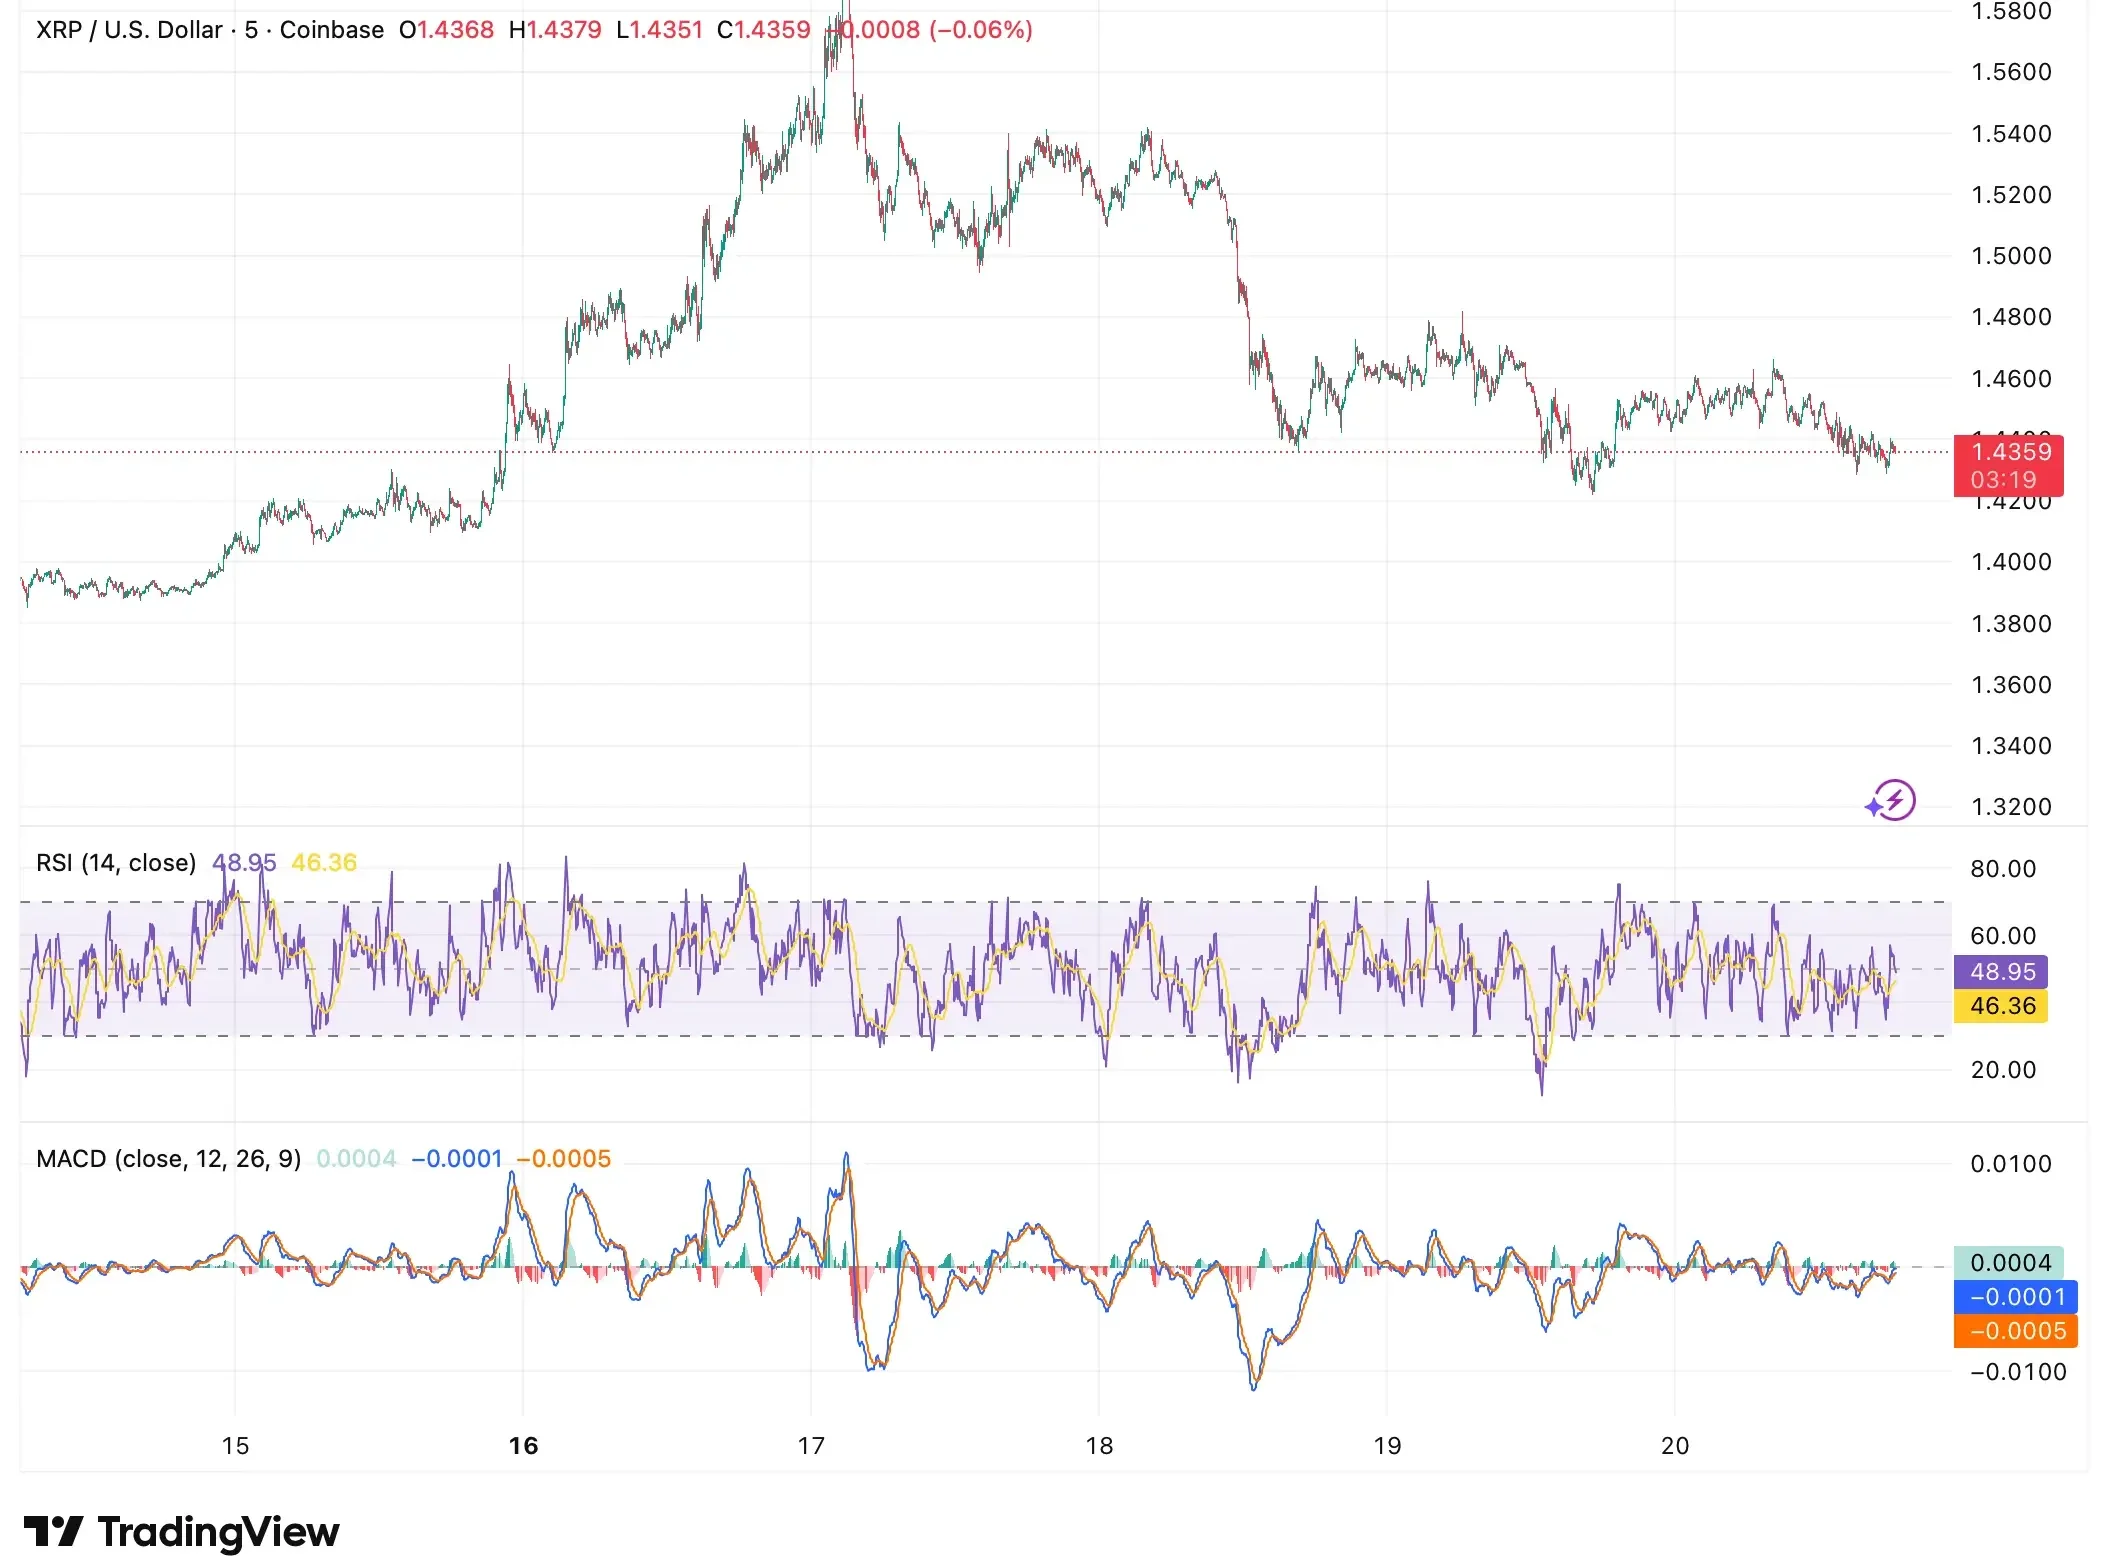
The pullback since March 17 has been orderly rather than panicked. RSI near 49 and a marginally negative MACD keep the technical picture neutral, but in a week where most assets disappointed on follow-through, XRP’s relative resilience stands out.
Solana: Flat on the Week, but the Chart Tells a Harsher Story
The weekly number for Solana is essentially zero – down 0.05%, rounding to flat. That sounds benign until you look at what happened in between. SOL pushed from the mid-$80s to nearly $96 on March 17, a move of close to 13% that briefly made it look like one of the more exciting setups in the market. Then came the reversal. Solana ETF’s recorded $0.8 millions in total inflows in the last trading day.
By Friday, Solana had given back almost the entire move, settling around $88.65.
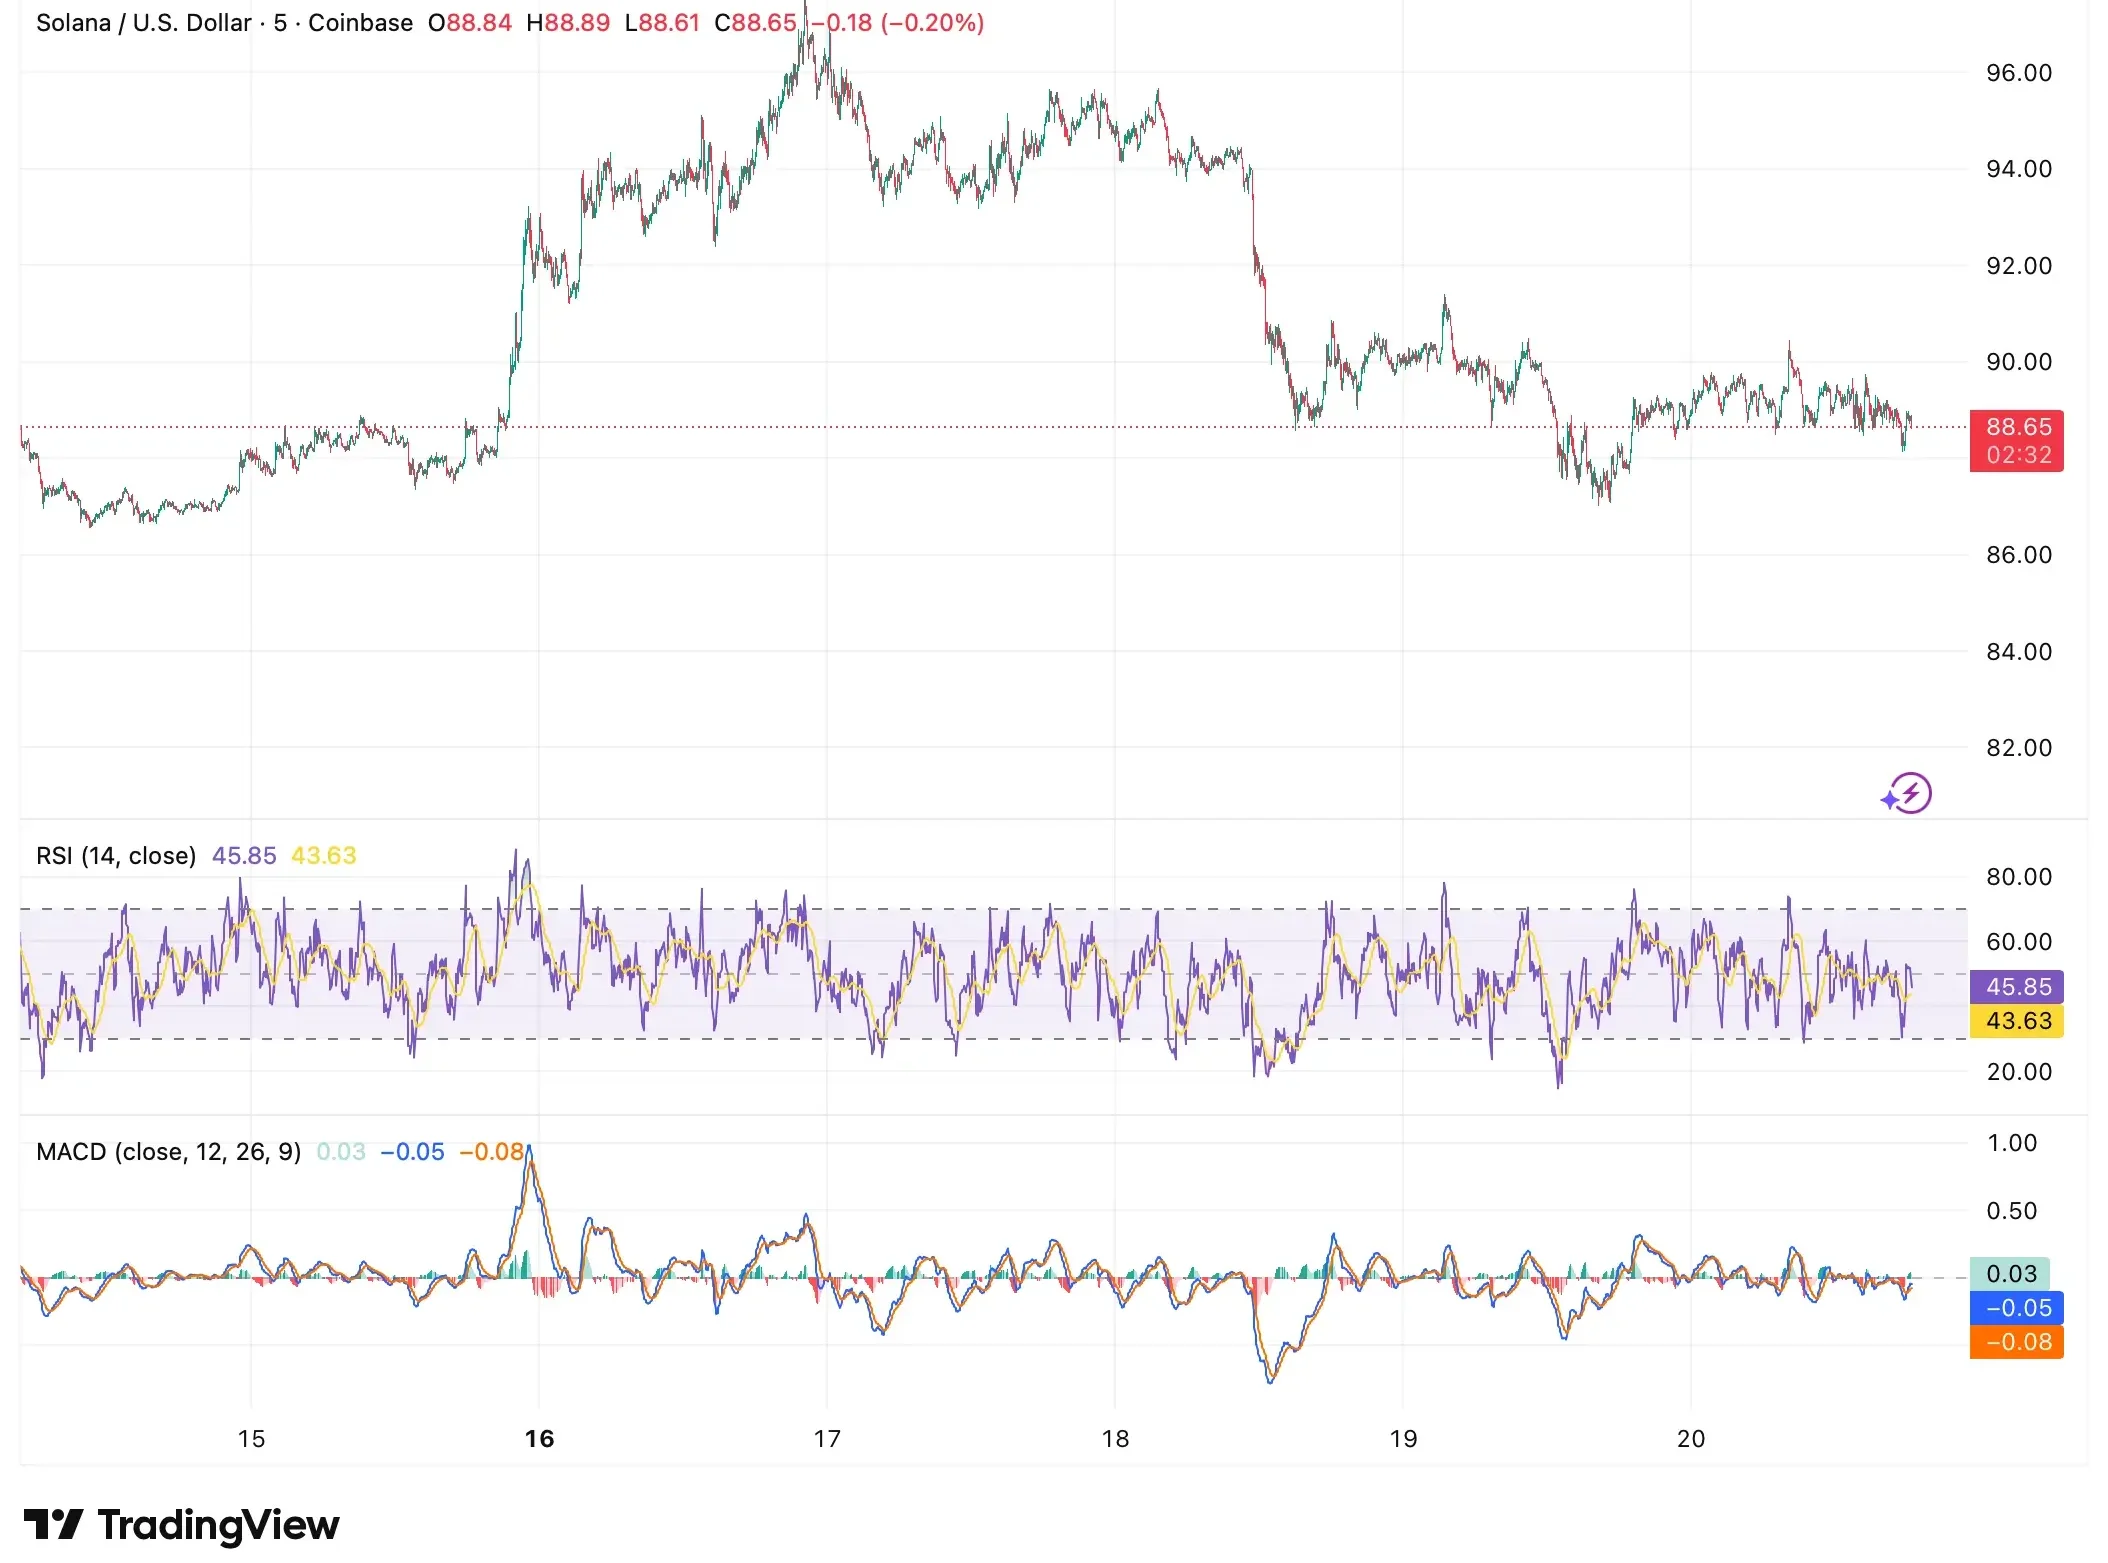
An RSI of approximately 46 and a MACD hovering just fractionally above zero paint a picture of a market that tried and failed to break higher. The $86 to $88 range is now the critical support zone. How SOL behaves around those levels next week will say a great deal about whether buyers are genuinely interested at current prices.
Hyperliquid: Biggest Winner, Sharpest Pullback
Hyperliquid is the week’s most interesting case study in both directions. A 6.47% weekly gain makes it the top performer in this group by a meaningful margin – and the chart shows why the number is simultaneously impressive and concerning. HYPE ran from $37 at the start of the week to above $43 at its peak on March 18, a move of nearly 16% that reflected genuine momentum and growing interest in the platform.
What followed was a steep and fast reversal that brought the price back to around $39, erasing more than half of the peak gain in a matter of days.
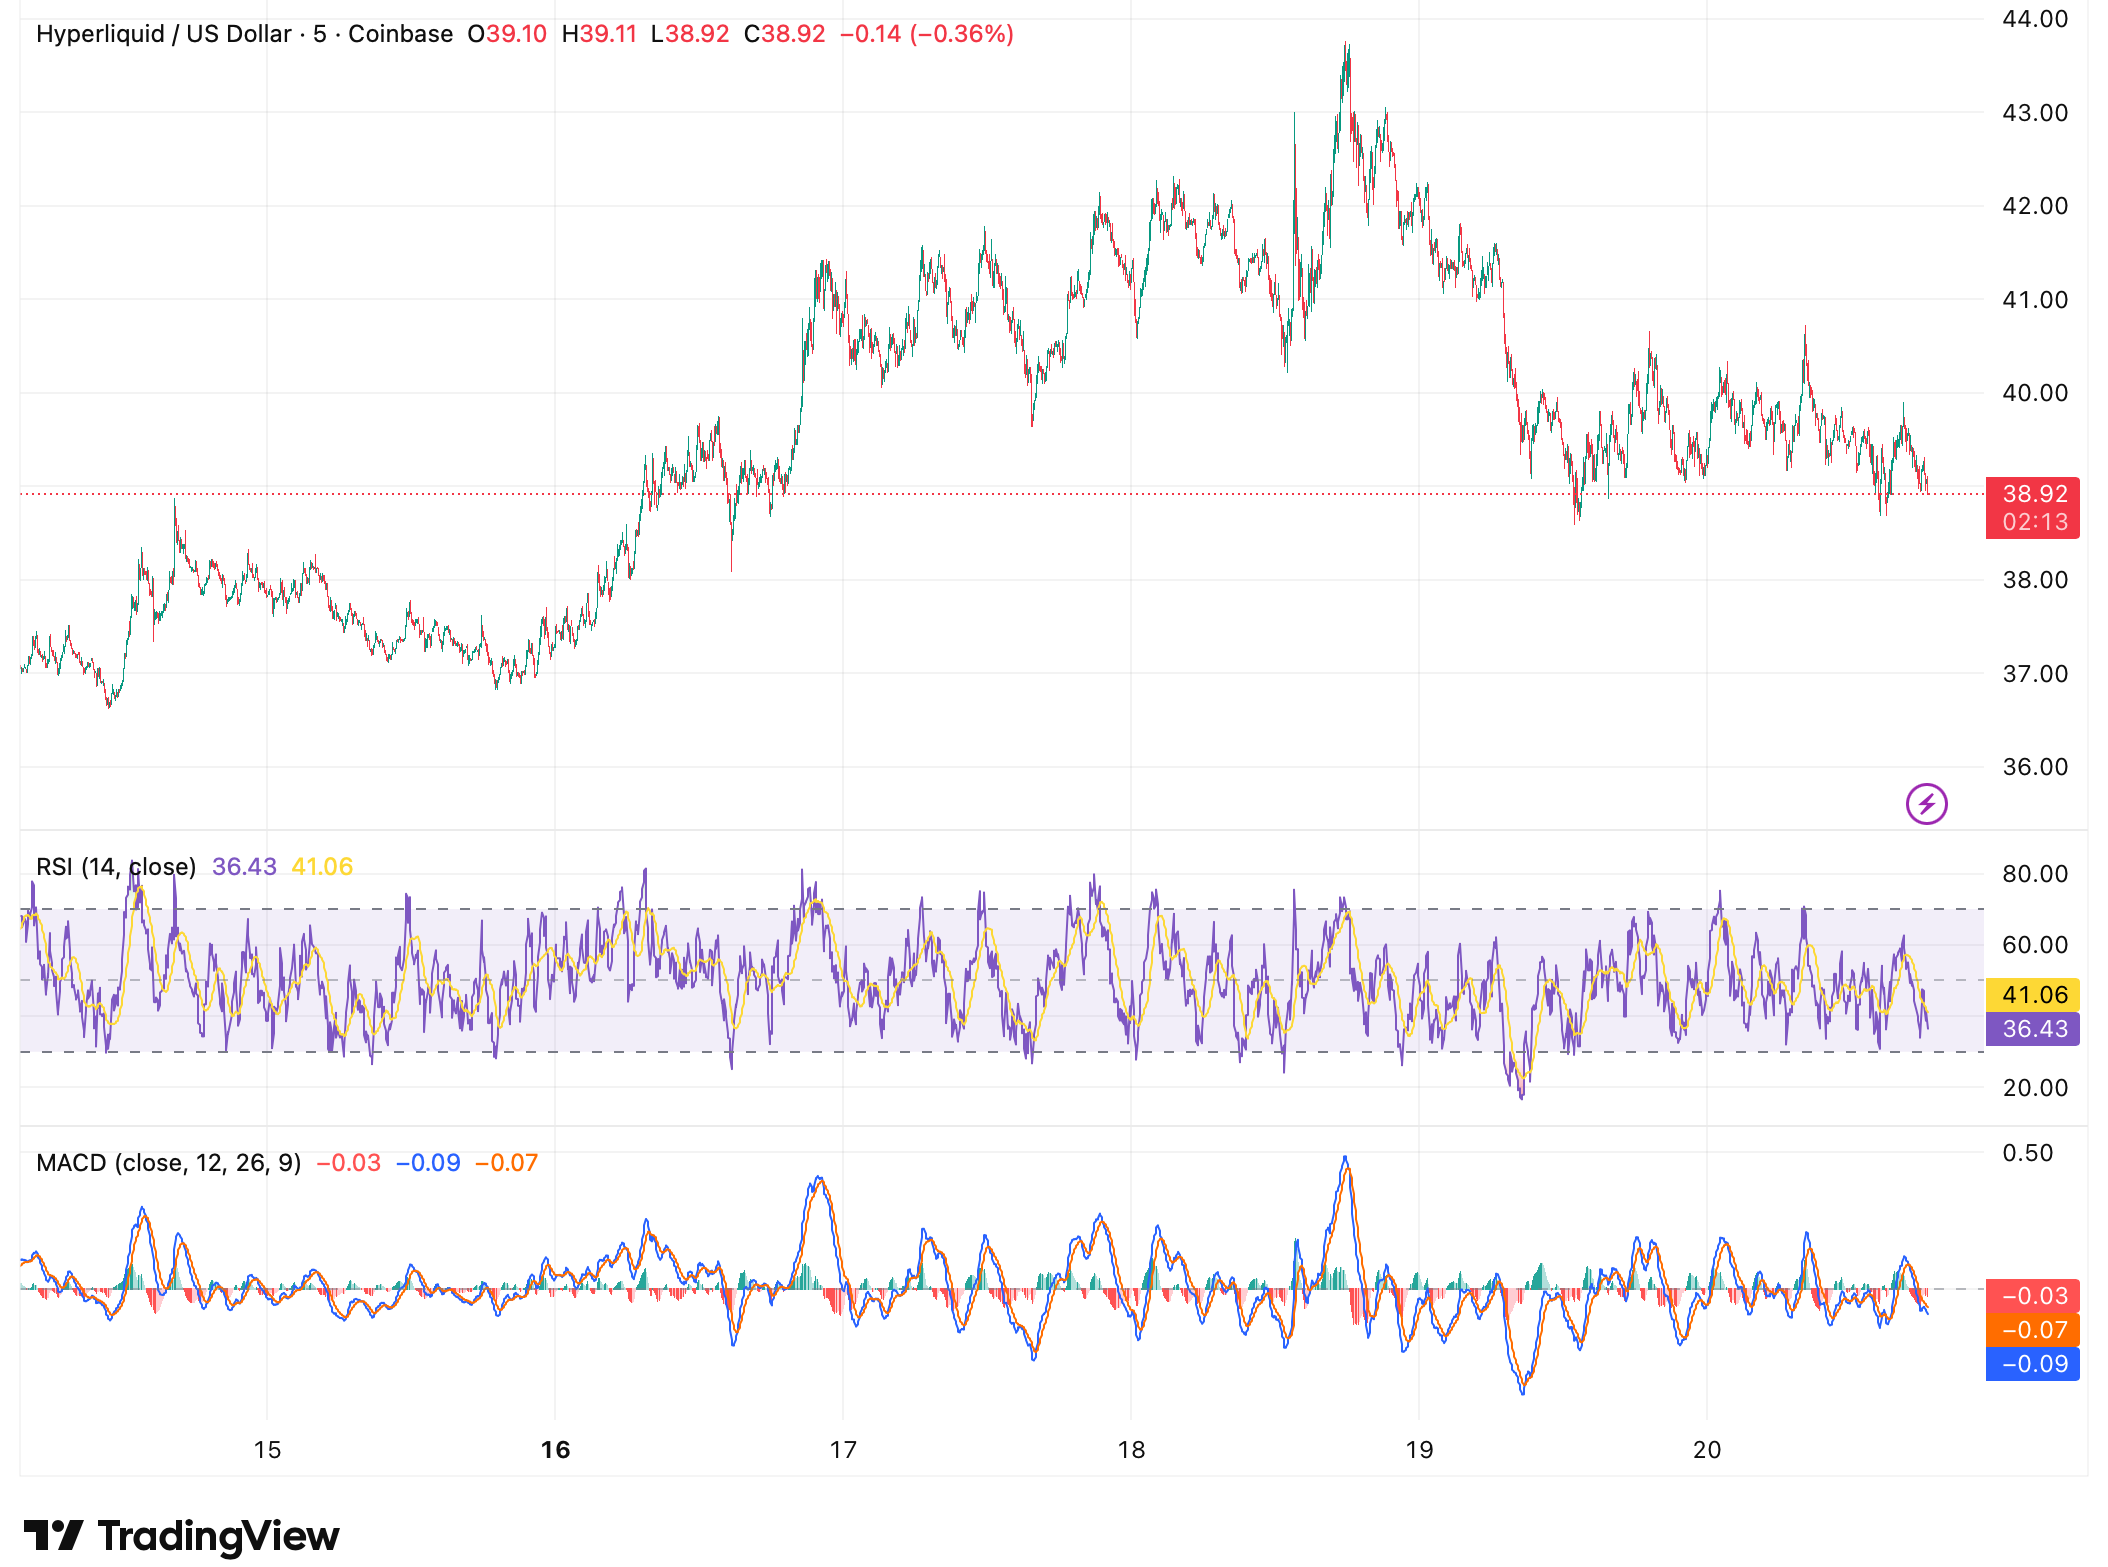
The RSI at approximately 36 is now approaching oversold territory – the most stretched reading of any asset covered this week. That can attract short-term buyers as positioning becomes too one-sided, but with the MACD negative across all three lines, the momentum has clearly shifted. HYPE bulls will want to see $38 hold as a floor heading into next week.
The Volume Collapse That Changes the Narrative
Whatever one makes of the weekly price action, the volume data is harder to spin positively. Altcoin trading volumes have fallen sharply across every major venue, painting a picture of an asset class that has lost a significant portion of its active participant base.
On Binance, altcoin trading currently sits at around $7.7 billion. During the October and February 2025 peaks – periods that coincided with local market tops and intense retail FOMO – Binance was processing between $40 and $50 billion in altcoin volume. Current levels represent a decline of roughly 80 to 85% from those highs. Across other major exchanges combined, the picture is similarly stark: approximately $18.8 billion today versus nearly $91 billion at the February 2025 peak and around $63 billion in October.
🗞️ Altcoin trading volumes collapse as investor interest fades
The analysis of altcoin trading volumes on Binance and other major exchanges highlights a clear loss of investor interest.
⚠️ Although the bear market is already well underway, altcoins continue to significantly… pic.twitter.com/D0epZzF5d2
— Darkfost (@Darkfost_Coc) March 20, 2026
Binance’s share of total altcoin volume now sits at around 40%, meaning roughly one in every two dollars traded in altcoins flows through the platform. That concentration is itself a symptom of the broader retreat – when volumes compress, activity consolidates on the most liquid venues while smaller exchanges see participation dry up almost entirely. The causes are not difficult to identify. Altcoins continue to significantly underperform Bitcoin, the broader risk environment remains unfavorable amid ongoing geopolitical tensions, and retail investors who drove the 2024 and early 2025 rallies have largely stepped back.
Volume Peaks as Exit Signals
One detail worth examining closely: both of the volume spikes that stand out – October and February 2025 – occurred not during periods of quiet accumulation, but at local market tops. Those periods were defined by intense FOMO-driven buying from retail participants who had watched prices rise and decided they could no longer afford to stay on the sidelines. The surge in demand was real. So was the wave of selling from better-positioned investors who used that demand as exit liquidity.
It is the oldest dynamic in financial markets: informed capital distributes into strength while less experienced capital accumulates near highs. The volume data does not just tell you how much is being traded – it reveals something about who is trading, and why. Elevated volume at price peaks is a warning sign in hindsight. Collapsed volume at price lows has historically been the setup that precedes the next meaningful recovery. That does not mean the bottom is in. It does mean the data is worth watching carefully.
Where Things Go From Here
The honest read on this week is that it was neither as strong as the weekly returns suggest nor as weak as the mid-week fade might imply. Altcoins gained ground. They also gave back a meaningful portion of those gains before the close. Volumes remain deeply depressed by historical standards, and the macro environment has not shifted in any way to suggest a sustained change in risk appetite is imminent.
What the data does offer is historical context. Volumes at current levels have in past cycles marked the zone where the most asymmetric opportunities begin to form – not because recoveries are guaranteed or arrive on schedule, but because the majority of impatient capital has already exited, leaving behind a market that requires considerably less buying pressure to move. The weekly gains are a start. The volume story is the one worth watching.
The information provided in this article is for educational purposes only and does not constitute financial, investment, or trading advice. Coindoo.com does not endorse or recommend any specific investment strategy or cryptocurrency. Always conduct your own research and consult with a licensed financial advisor before making any investment decisions.

Alexander Zdravkov is a person who always looks for the logic behind things. He has more than 3 years of experience in the crypto space, where he skillfully identifies new trends in the world of digital currencies. Whether providing in-depth analysis or daily reports on all topics, his deep understanding and enthusiasm for what he does make him a valuable member of the team.