$592 Million in XRP Withdrawn From Exchanges as Price Drops: What’s Next?

Whale inflows to exchanges have collapsed to near zero while $592M in XRP was withdrawn in two days. The price is falling. The on-chain structure is not.
Key Takeaways
- XRP fell to $1.29, breaking below the 50 SMA at $1.3345 on heavy volume.
- RSI at 34.99 – approaching oversold, no reversal signal forming yet.
- $592.3M in XRP withdrawn from Binance and Coinbase.
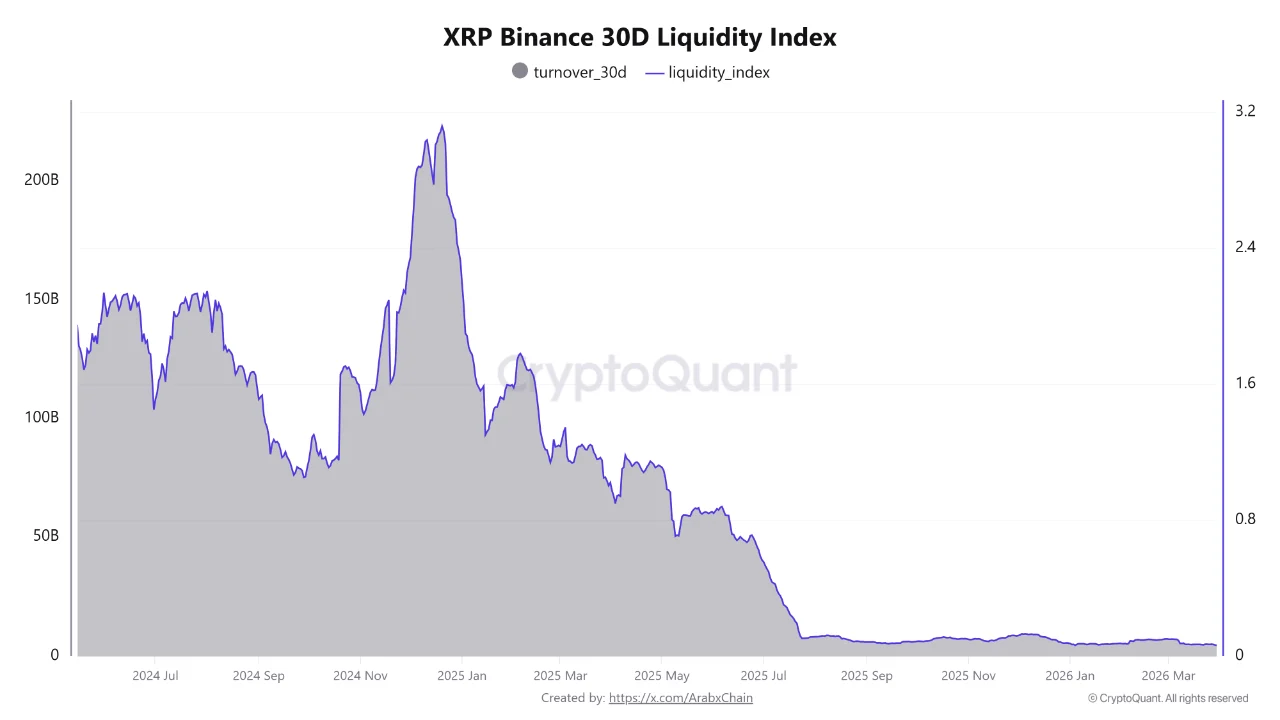
- 30-day liquidity index at 0.062 – one of the lowest levels ever recorded on Binance.
- 30-day turnover at $4.46B versus historical peaks above 200B.
XRP is trading at $1.29 at the time of writing on the 1 hour chart, down sharply from the $1.37 recovery high reached just days earlier, sitting below its 50-period Simple Moving Average at $1.3345, with the RSI printed at 35 and still falling. Trump’s primetime address ruled out near-term de-escalation with Iran and the broader crypto market sold off. XRP moved with it, dropping more than 5% from its April 1 high and breaking a support level it had held for six consecutive days.
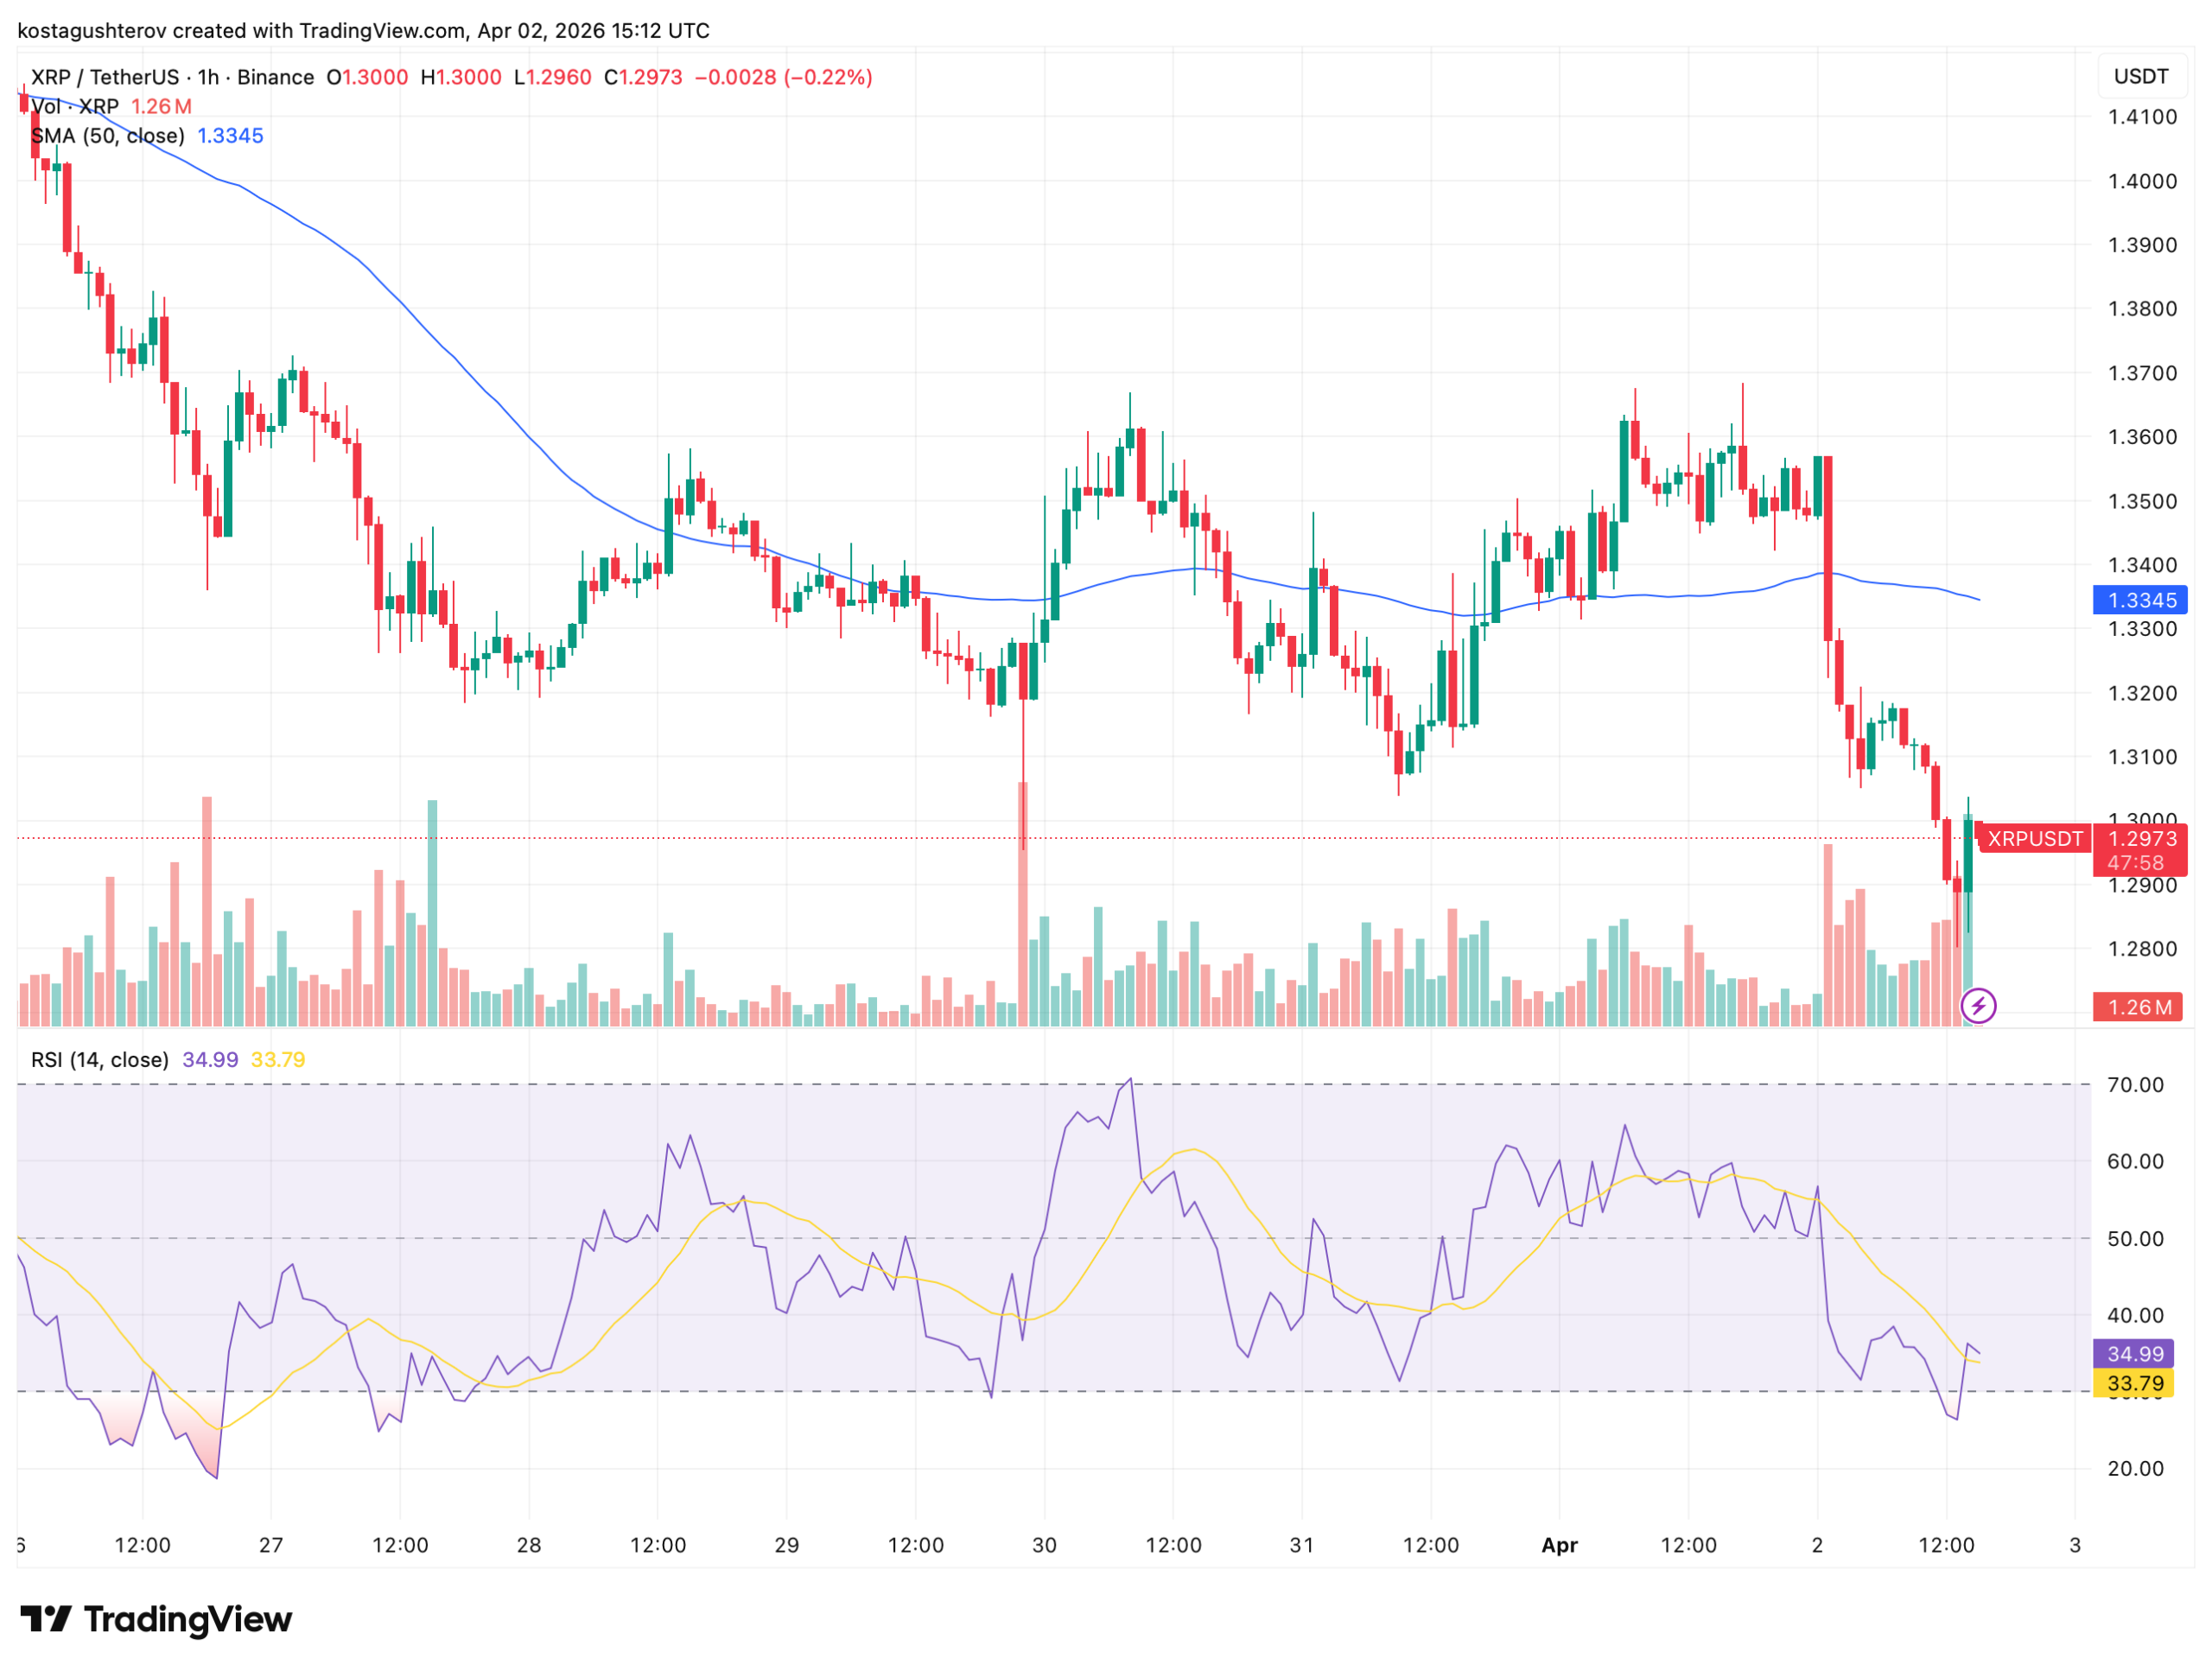
There is technical space between the current level and a washed-out bottom. Key support sits at $1.28, the horizontal level visible as a prior consolidation zone on the chart. Below that, $1.20 represents the next meaningful structural floor. The 50 SMA has flipped from support to resistance, reclaiming it is the first requirement for any credible recovery thesis.
The Whale Story: From Selling to Withdrawing
The most important data point in the XRP market right now is not the price. It is the shift in whale behavior over the past two weeks, and it tells a story the price chart does not.
According to CryptoQuant’s whale-to-exchange flow data for Binance, whale inflows peaked at approximately 44,000 XRP in mid-March, the same week price reached $1.55.
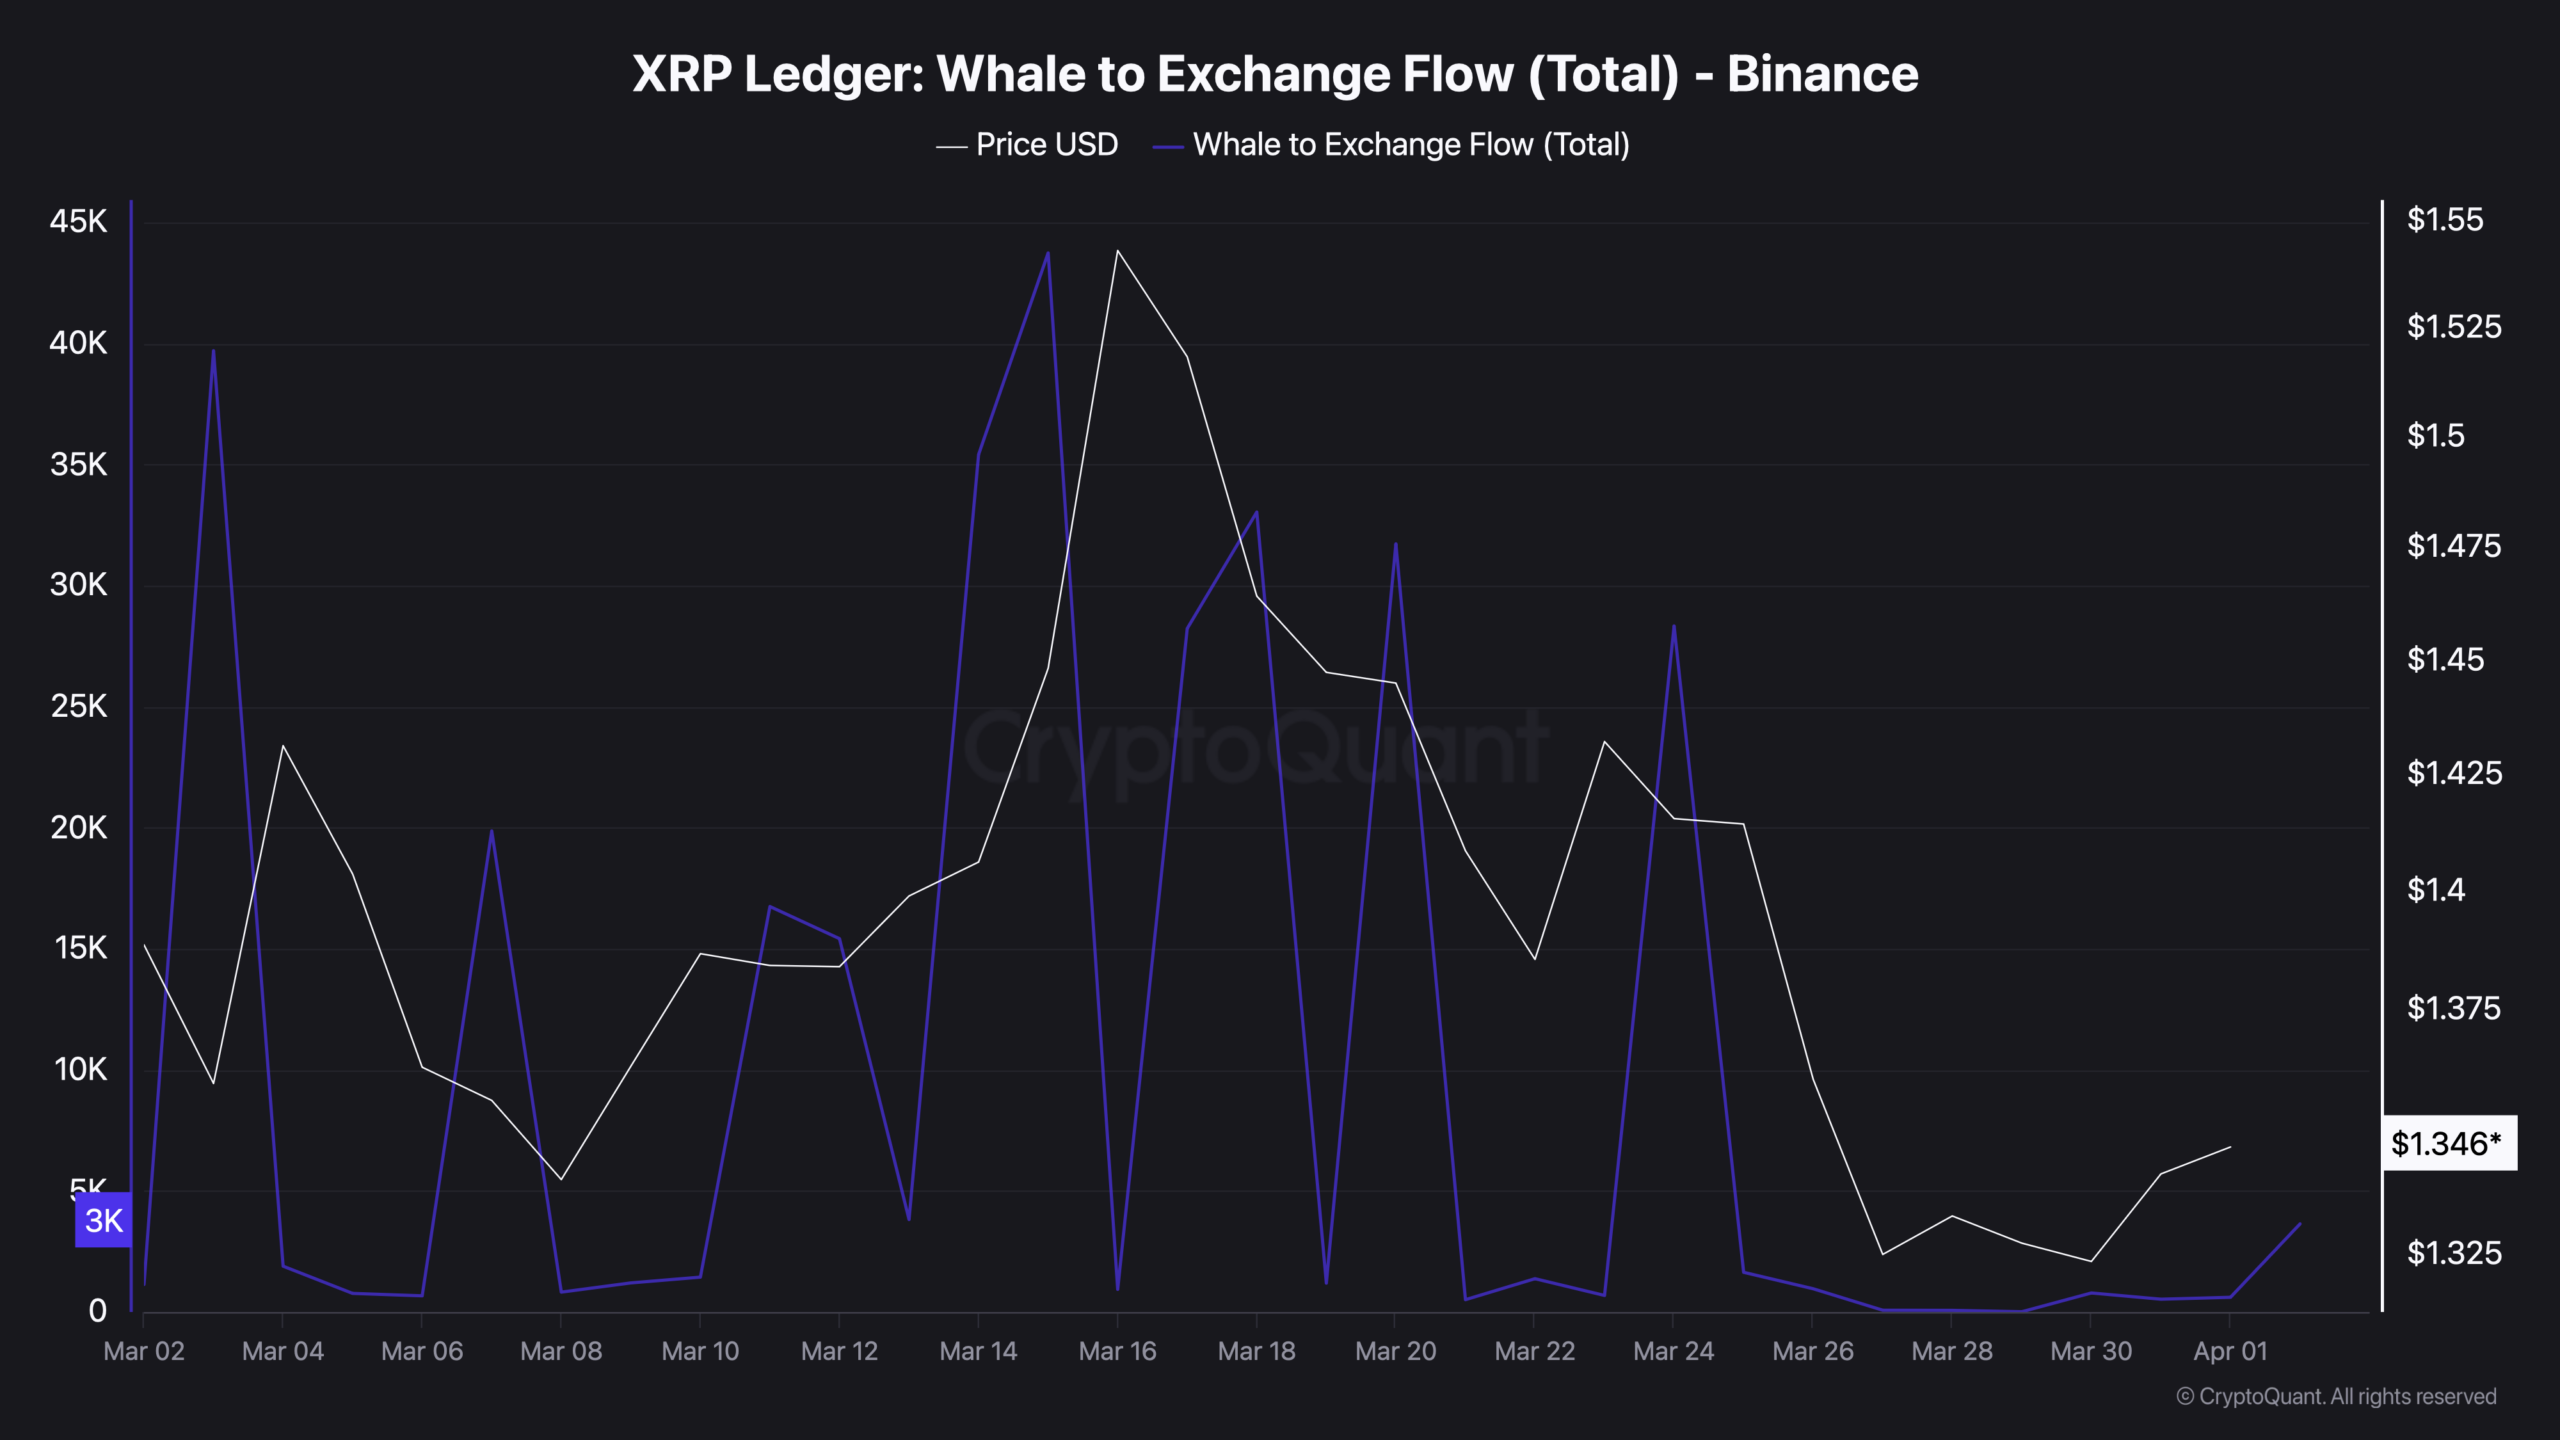
The correlation is direct: large holders were moving XRP onto exchanges, creating sell-side supply, and price reflected that pressure in real time. After March 26, those inflows collapsed. By April 1 the daily flow had dropped to approximately 3,000, a near-complete withdrawal of the selling pressure that had defined the prior two weeks.
What happened simultaneously on the withdrawal side reframes the picture further. Across just two sessions in late March, whale-sized holders pulled 442 million XRP, worth $592.3 million, off Binance and Coinbase.
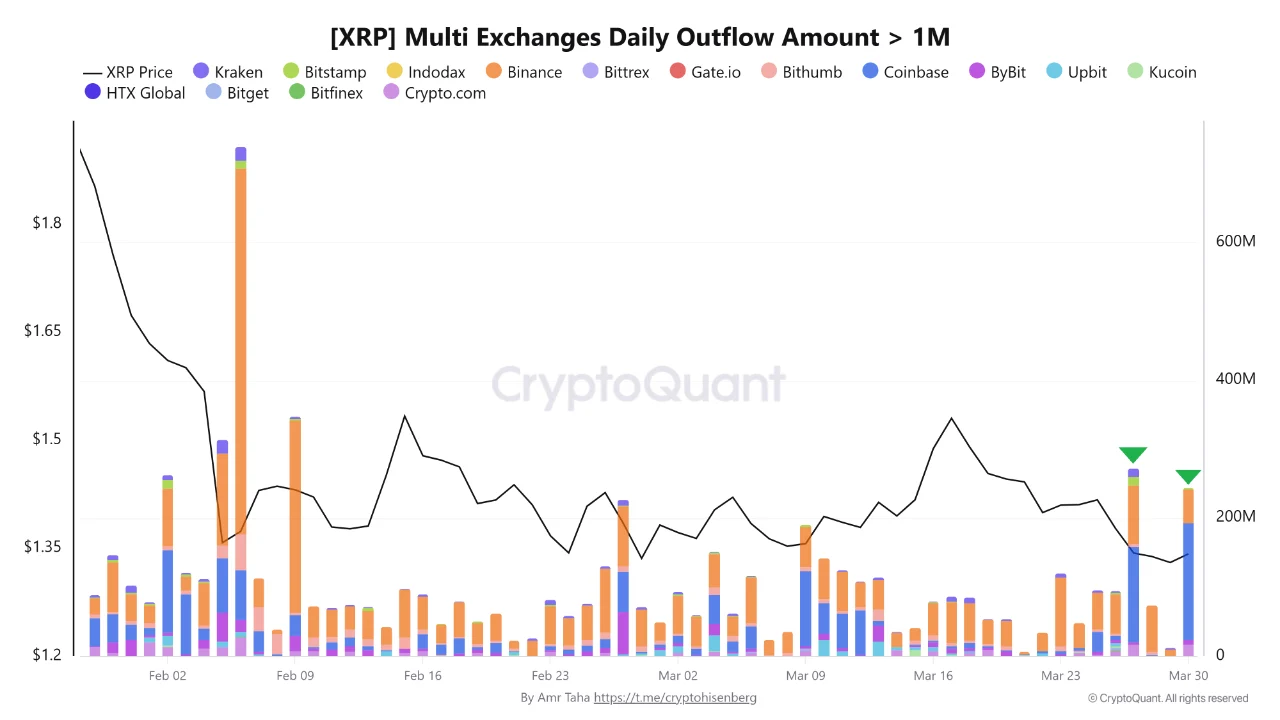
To understand what that number means, consider the sequence: on March 27, Binance recorded 85 million XRP in large outflows ($113.9 million) while Coinbase recorded 138 million XRP ($184.9 million), bringing the combined daily total to $298.8 million. Three days later, on March 30, Binance added 49 million XRP ($65.7 million) and Coinbase recorded 170 million XRP ($227.8 million), for a second daily total of $293.5 million. Two sessions. $592.3 million. The only comparable event in recent history was the 530 million XRP single-day spike on February 6, which remains the largest on record.
The daily average for outflows through most of March was approximately 50 million XRP. The late-March wave ran nearly six times that pace. XRP that leaves an exchange is no longer available for immediate sale. When whale-sized holders move assets to self-custody rather than leaving them on exchange, the structural sell-side pressure on price decreases, even when the price itself has not yet responded to reflect that change.

The Liquidity Problem and What It Means for the Next Move
Except the statement from Trump that the US will hit Iran “Extremely hard“, the April 2 selloff was sharp for another specific reason, and that same reason explains why the next move, whichever direction it goes, will not be gradual.
XRP’s 30-day liquidity index on Binance has fallen to approximately 0.062, according to CryptoQuant, one of the lowest levels recorded in recent periods and a dramatic collapse from the peaks above 3.2 seen in mid-2025. The 30-day turnover index stands at $4.46 billion, compared to historical peaks that exceeded 200 billion. Buy and sell orders are less dense than at any point in recent memory. The market depth that would normally absorb large trades is simply not there.
In practical terms this means relatively small trades move price disproportionately. It is why the April 2 drop cut through support levels in hours rather than days. It is also why when buying interest returns, it will not ease XRP back up gradually, it will gap it. Low liquidity is not inherently bearish or bullish. It is an amplifier. And right now the amplifier is set to maximum.
Two Outcomes From Here
If selling pressure continues, the path lower is clear and technically unobstructed. The 50 SMA at $1.3345 has become resistance. The RSI at 35 has not reached the capitulation readings seen at previous XRP cycle bottoms. Key support at $1.28 is the immediate line, a daily close below it opens $1.20 and the broader structural floor.
If the structural data leads, the honest caveat is that the chart alone cannot tell you when. For the past month, almost every meaningful price movement across the crypto market, has not been driven by technical levels or on-chain data. It has been driven by a single variable: the news cycle around the Iran war.
A ceasefire headline pushed XRP from support to resistance in hours on March 31. Trump’s address reversed that move overnight. The technical setup and the whale withdrawal data create the conditions for a recovery, but in this market, conditions are not catalysts. The catalyst is a headline, and no chart can tell you when it arrives.
What the structural data does tell you is this: whale inflows to exchanges have collapsed to near zero, removing the active selling pressure of mid-March. $592 million in XRP has left exchanges in the past week, reducing immediately available sell-side supply to its lowest level since February. And with the liquidity index at 0.062, even modest buying interest, sparked by any shift in the war narrative, will move price more sharply than it would in any normal market environment.
The whale data says accumulation. The price chart says distribution. The liquidity index says whichever one wins, it will not be a slow move.
The information provided in this article is for educational purposes only and does not constitute financial, investment, or trading advice. Coindoo.com does not endorse or recommend any specific investment strategy or cryptocurrency. Always conduct your own research and consult with a licensed financial advisor before making any investment decisions.

Alexander Zdravkov is a person who always looks for the logic behind things. He has more than 3 years of experience in the crypto space, where he skillfully identifies new trends in the world of digital currencies. Whether providing in-depth analysis or daily reports on all topics, his deep understanding and enthusiasm for what he does make him a valuable member of the team.