How to Read Crypto Charts Like an Expert

For those looking to understand how to read crypto charts to sell or buy digital assets, this one is for you. There’s no need to panic; learning how crypto charts work and what they are underneath could only bring a positive outcome to your trading strategies, thus making informed decisions.
Reading crypto charts is one of the essential skills crypto traders and investors could use to upskill their trading activity and learn to assess and predict future price movements while discovering major market trends to gauge market sentiment and stay on the safe side of crypto investing.
While enhancing your technical analysis abilities is vital for the crypto market, please refrain from fooling yourself with the technicality of the terms and concepts.
Better yet, imagine them as an extension of yourself through which you make informed decisions and assess the best available options for your trading activity through trading volumes, chart patterns, and other market-based technical indicators.
So, in today’s article, we are discussing anything you need to know and how to read crypto charts, from the basics of crypto charts to crypto charts indicators, technical analysis tools and concepts, how to read candlestick charts, and identify potential trend reversals, while knowing about the crypto charts drawbacks.
[nativeAds]
The Basics of Crypto Charts
You can also look up the crypto price chart for any trading pair when trading on a crypto exchange. The most common crypto pairs consist of crypto and USD, yet they can also be crypto-crypto pairs.
Take Crypto.com as an example and look for one of their crypto charts for the BTC-USD trading pair. For a more exact and transparent comparison, crypto price charts often pair a cryptocurrency with a fiat currency, such as the US dollar.
So, let’s break it down further and discover the basics of crypto charts.
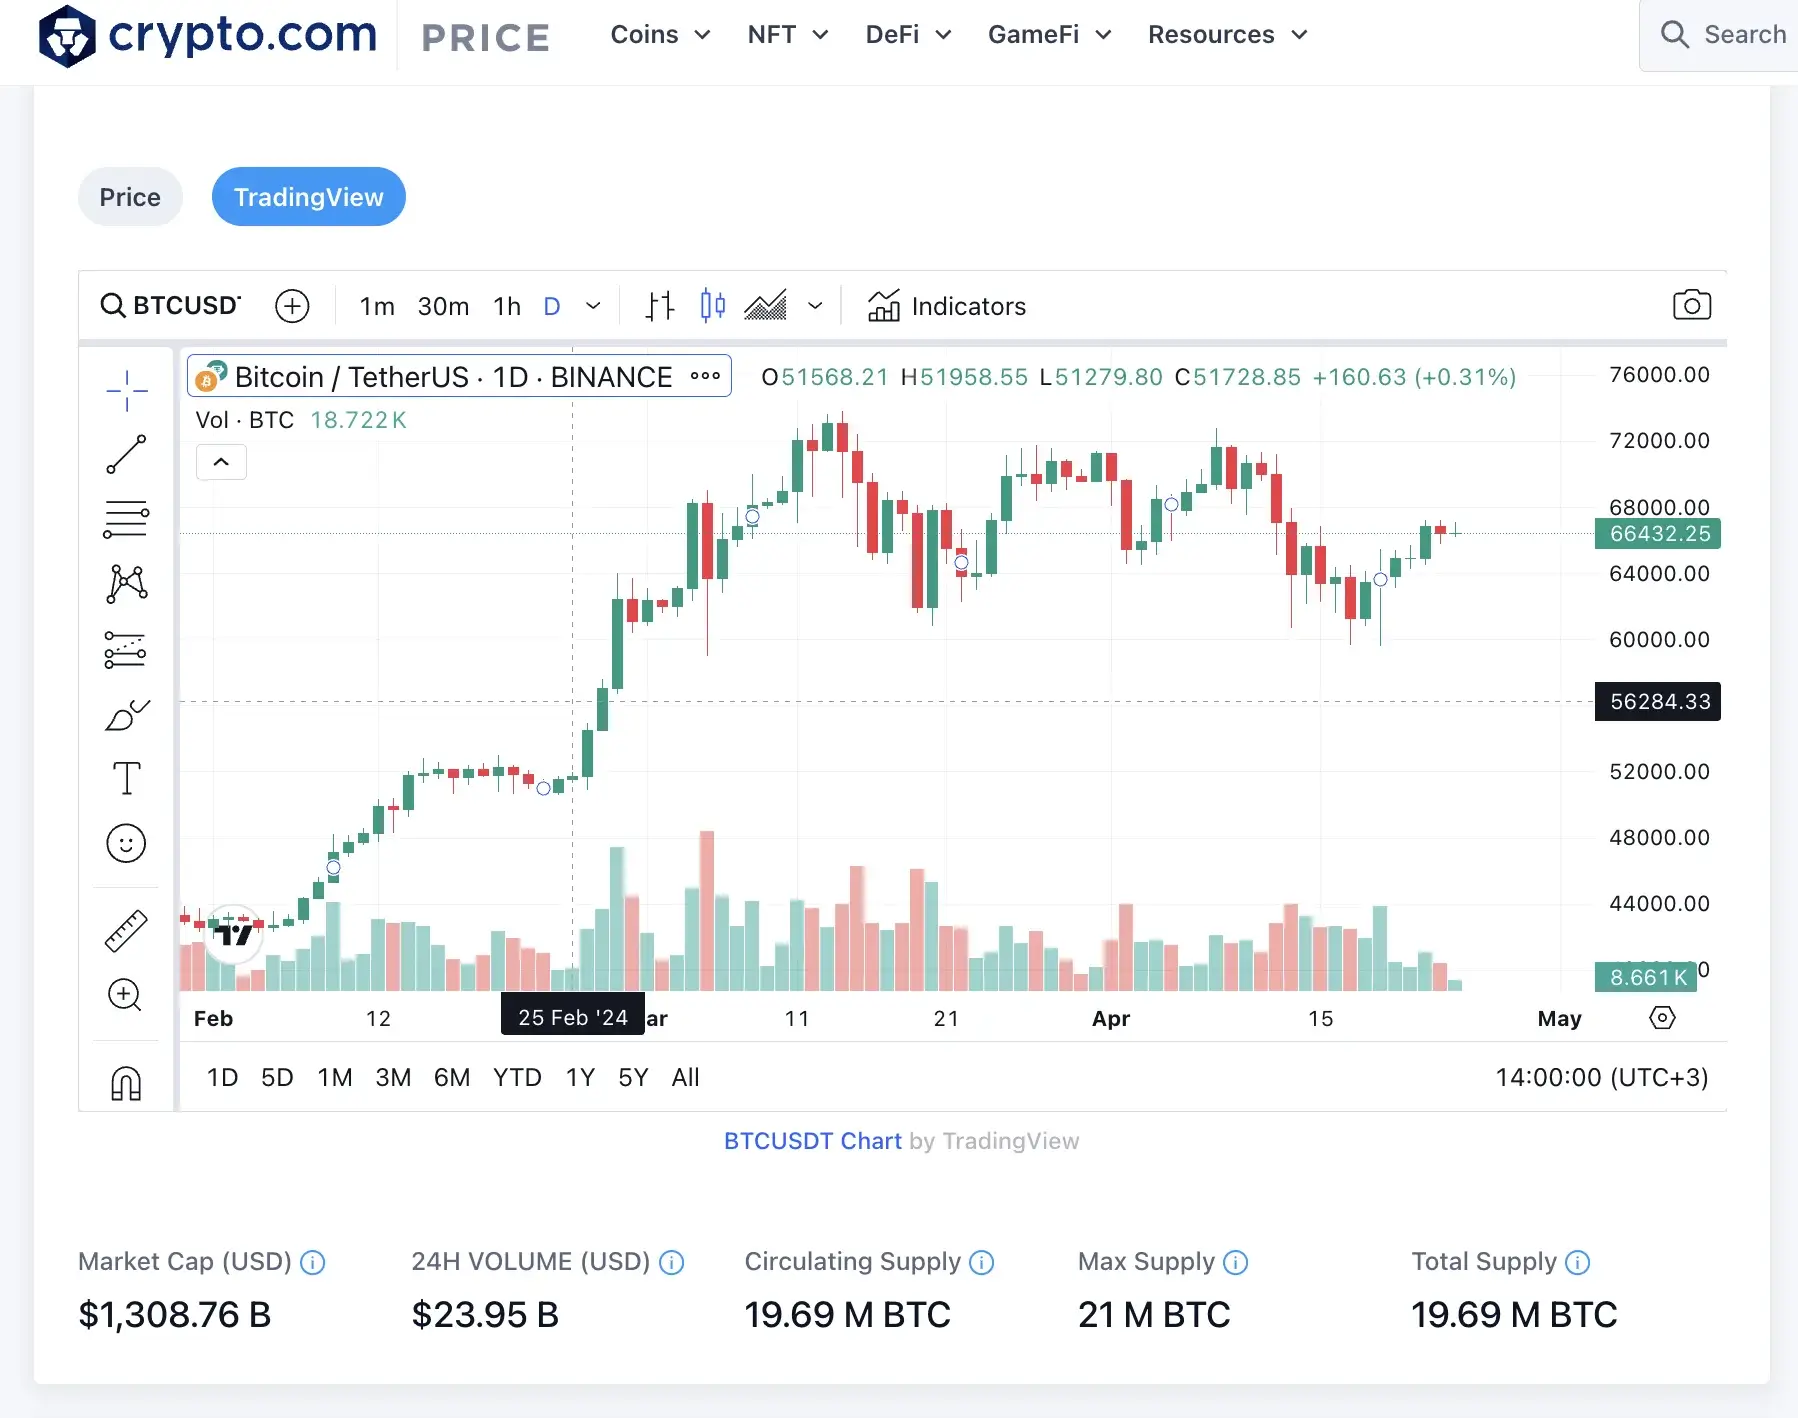
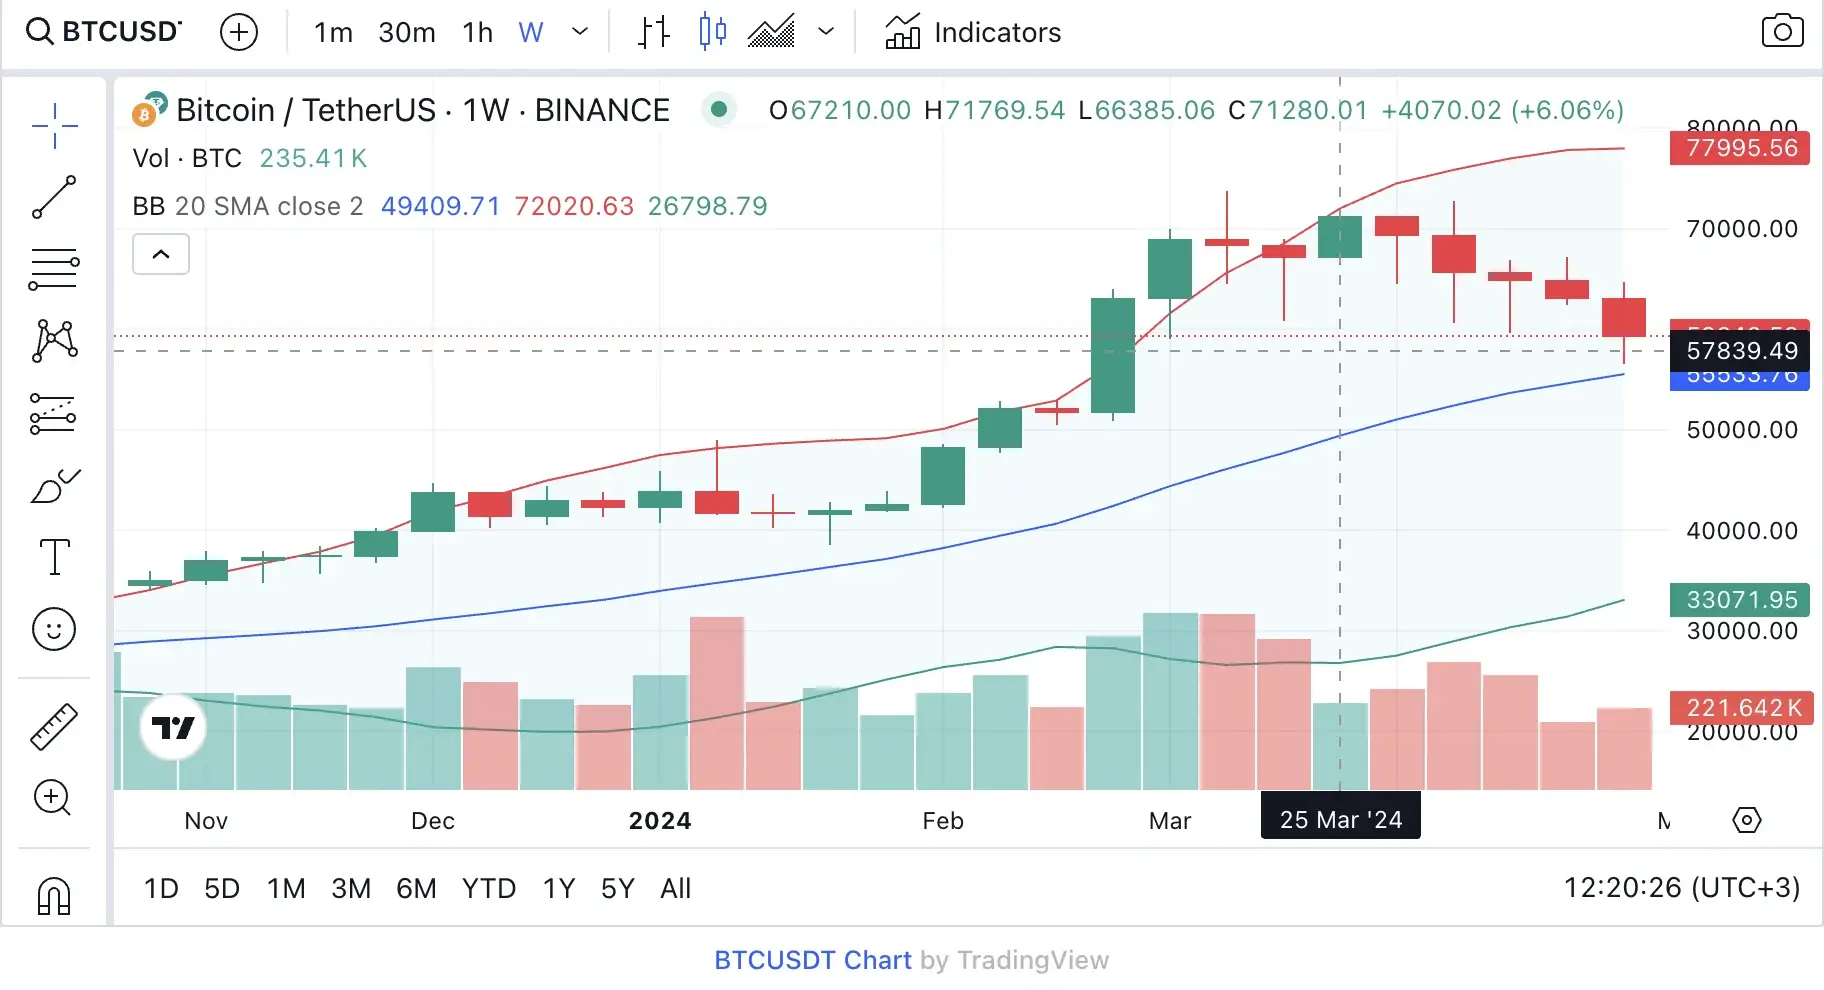
1. The Trading Pair
This one refers to the base or leading cryptocurrency, Bitcoin (BTC), and the quote currency, Tether (USDT), one of the largest stablecoin-based on the US dollar.
A crypto trading pair is vital for trading on a crypto exchange, as it allows users to trade one currency against the other without exchanging it for fiat.
2. The Current Price
The following essential aspect is the current price for the base currency, meaning Bitcoin (BTC), which is being sold or bought for the quote currency, Tether (USDT). Moreover, by reading crypto charts, you can also see the 24-hours price movements, which can quickly change based on specific market trends.
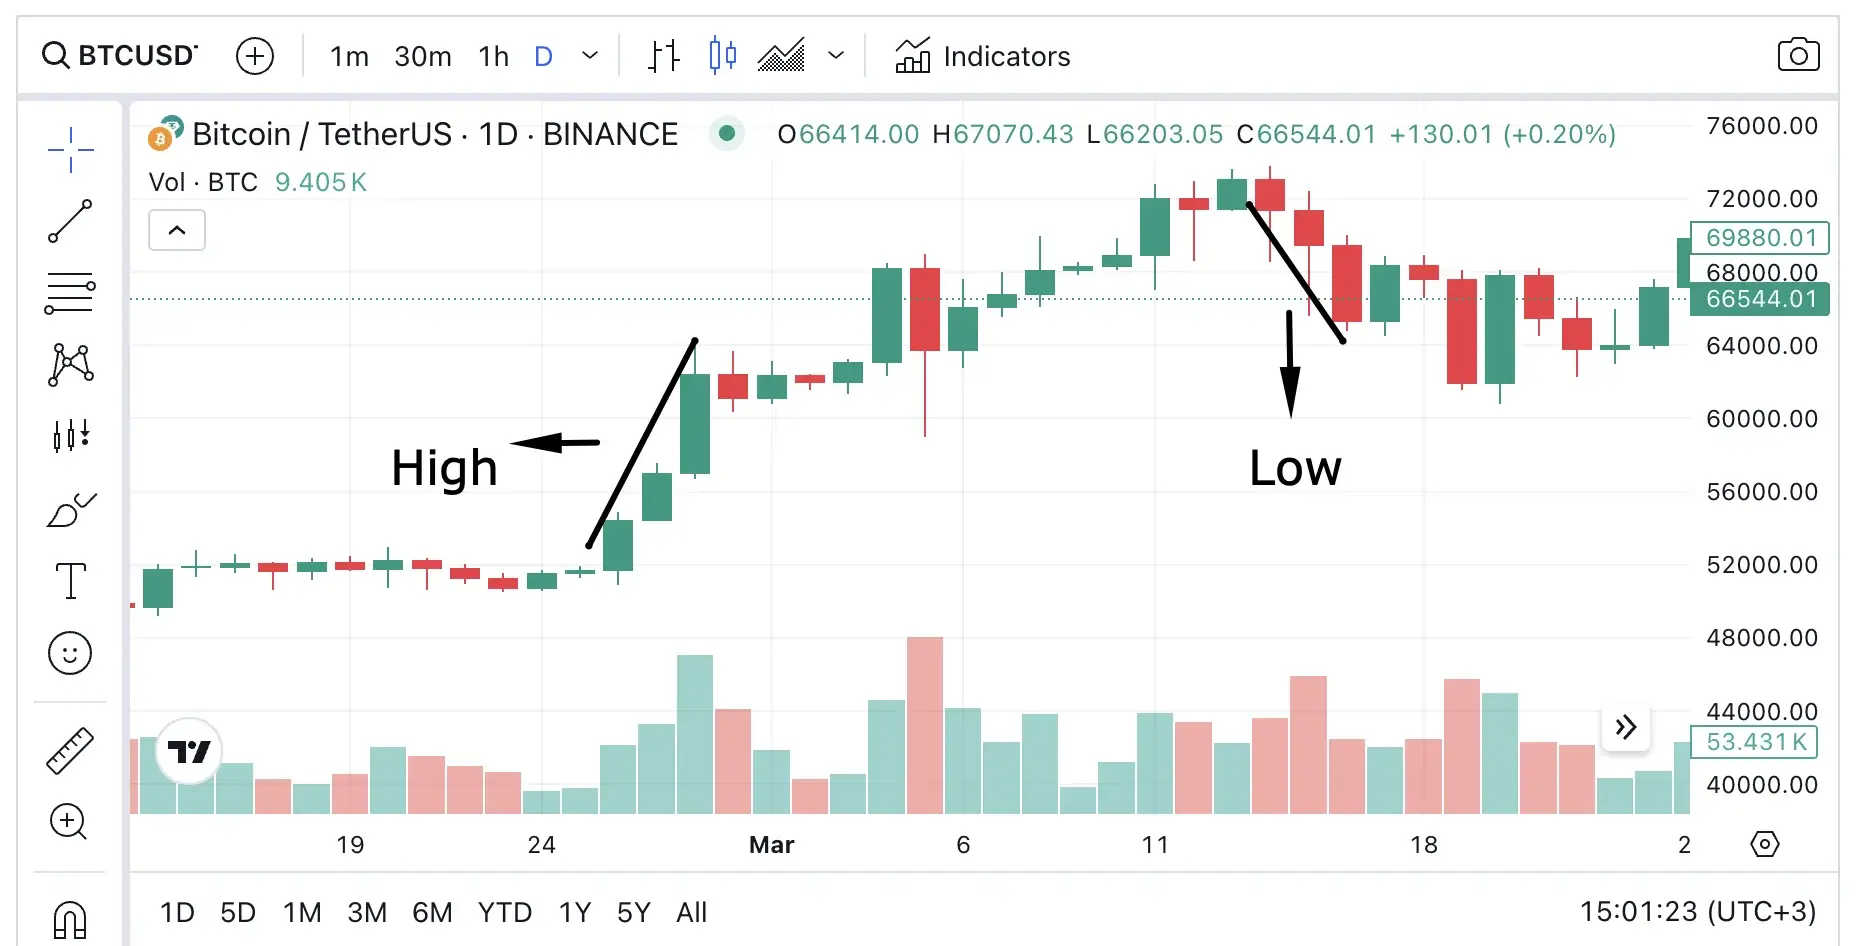
3. The Highest and Lowest Prices
This criteria allows you to analyze the 24-hour change of the highest and lowest price movements, as seen in the picture below.
4. 24-hour Volume
With the help of the 24H volume, you can assess the trading volume of Bitcoin, which, in our example, is over 34 hours, whereas the volume is expressed through the quote currency, USDT.
Moreover, you could say that this is a crucial data point as it allows you to measure the investor’s interest in the cryptocurrency and how much it has been traded in the past 24 hours.
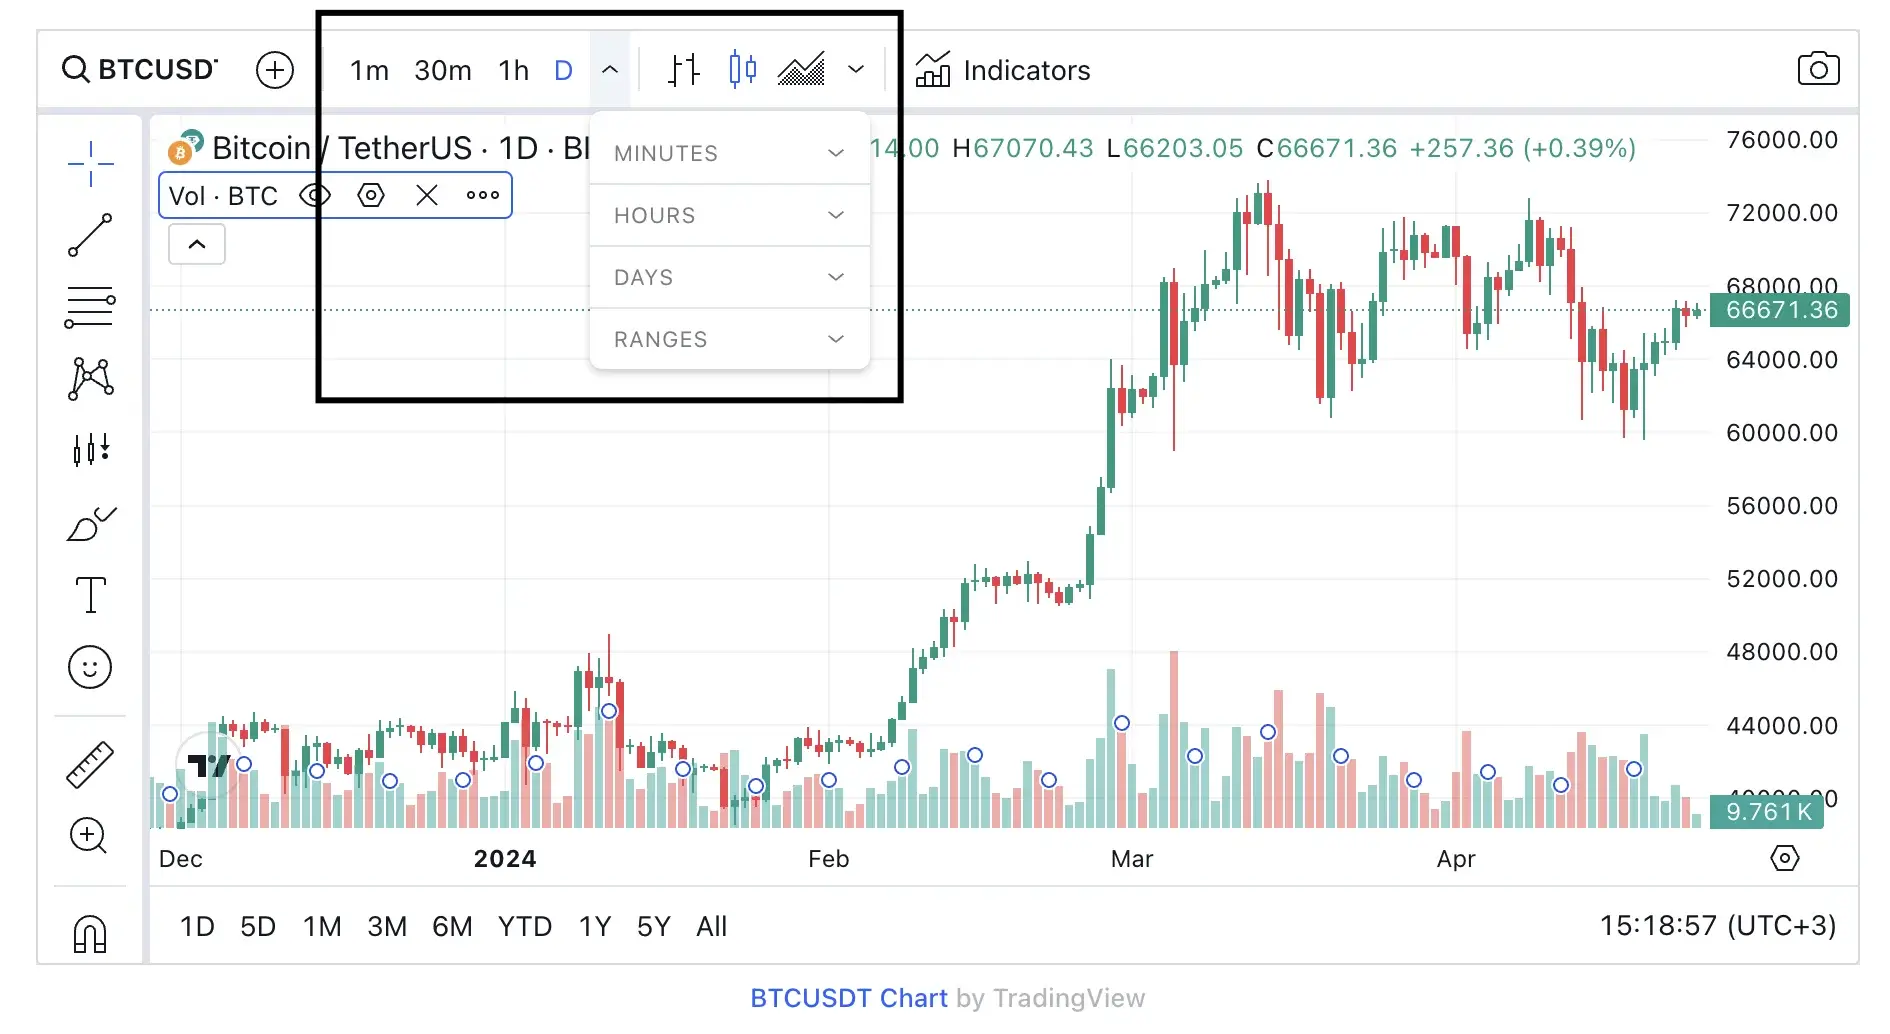
5. Unit of Time
You can also select the timeframe in which you aim to read the crypto charts. Therefore, you can choose from minutes, hours, days, and even ranges.
6. Price Chart Patterns
Just as the name says, through these criteria, you can better visualize the price movements, meaning the rise and downfalls of the cryptocurrency on a said time frame, such as 24H, days, months, and years.
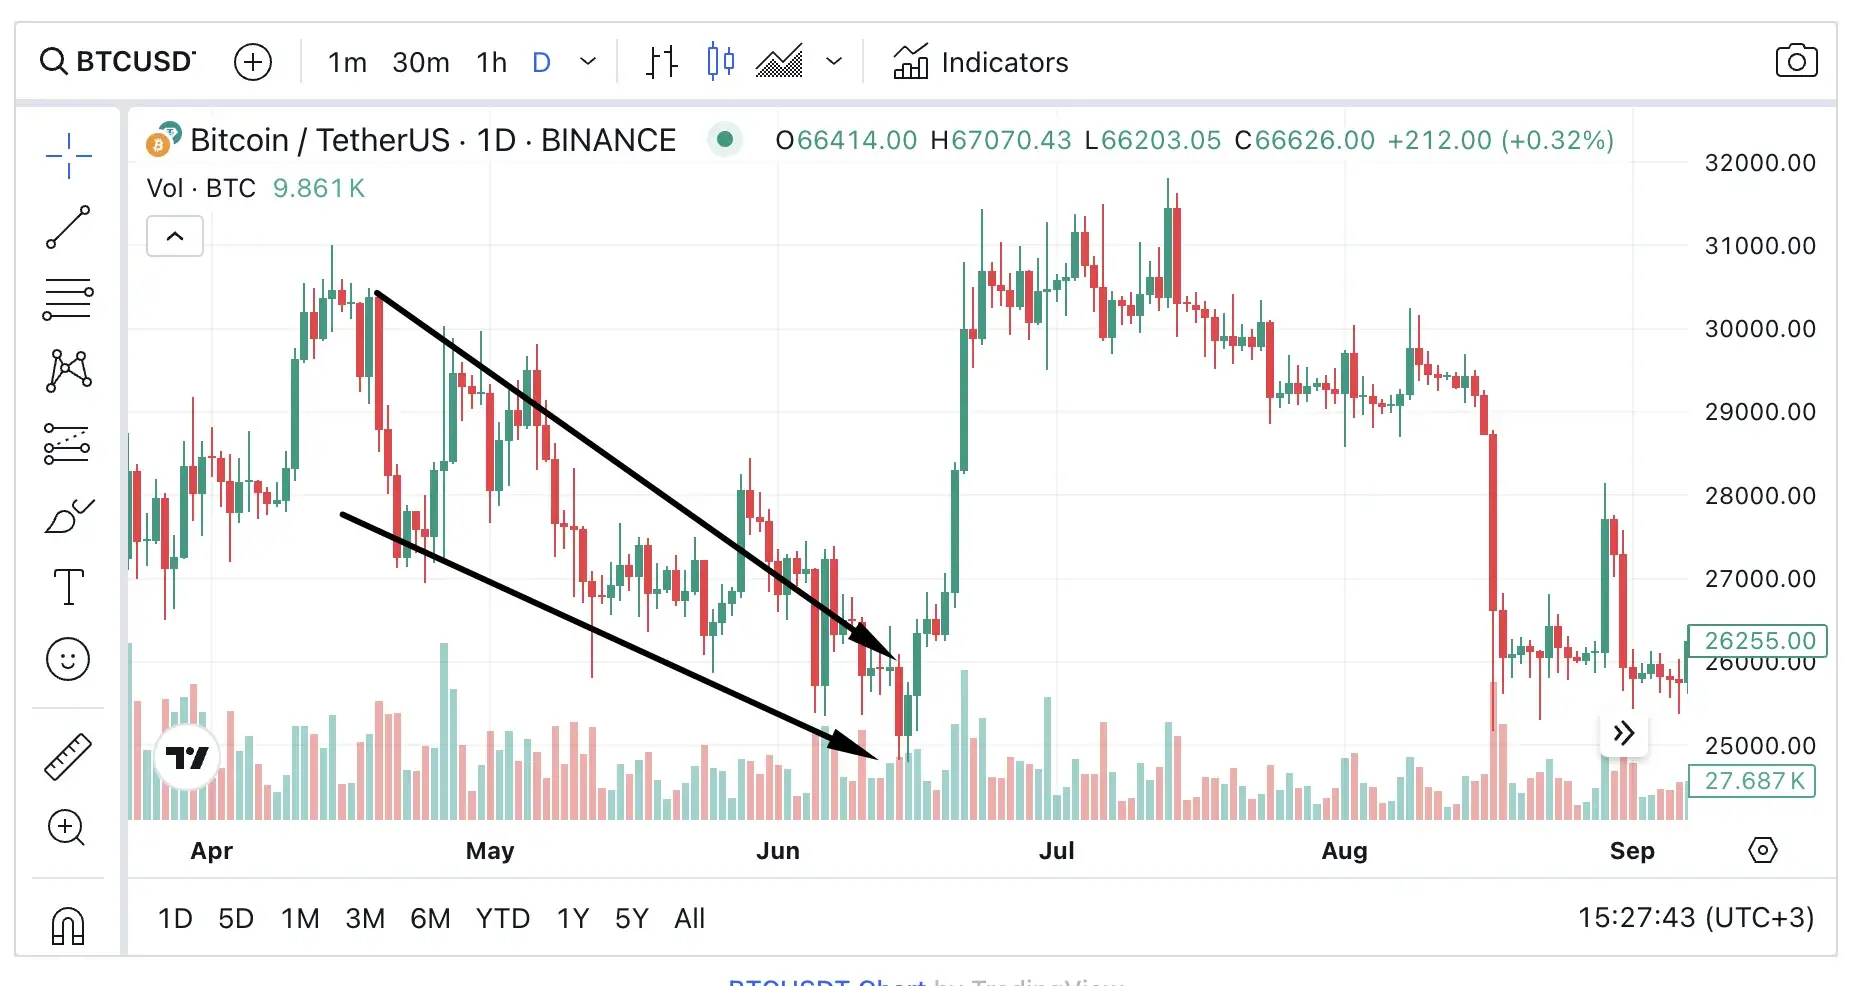
7. Trading Volume Chart
Right under the main crypto chart that looks at the price movements, there’s the trading volume chart, indicating the trading volume of your asset.
So, there’s nothing too complicated, as the longer bars indicate higher trading volumes, while the colors analyze the price movement, such as green for a price increase and red for a price decrease.
As you can see, it isn’t rocket science, yet it requires a great deal of attention until you figure it out on your own. But you can always look at explanatory videos, take notes, and practice, which makes it all perfect.
In our opinion, analyzing the crypto chart patterns could only help you in your trading cryptocurrencies endeavors and could set you and your gains apart as a pro from a noob.
What Are the Crypto Charts Indicators to Look Into?
Many crypto chart indicators aim to assess your trading strategies and analyze the crypto market sentiment while gaining insights into market trends. However, most of these crypto chart technical indicators are lagging, which defeats the purpose of using them when needed.
One common mistake new but enthusiastic crypto market participants make is using too many technical indicators simultaneously, which can get out of control, leaving them overwhelmed and still not offering a broader view of the market movements.
Some of the essential ones are the Relative Strength Index (RSI), Moving Average Convergence Divergence (MACD), Fibonacci Retracement, On-Balance Volume (OBV), Ichimoku Cloud, Stochastic Oscillator, Bollinger bands, and many others.
But one thing is clear: all crypto chart indicators derive from price movements and/ or trading volume. Therefore, they should only be used in conjunction with the price. You could think of technical indicators as a layer on price charts to identify trends, momentum, and potential support/ resistance levels.
Types of Crypto Charts Indicators
Many technical indicators exist, as discussed, but let’s delve deeper into the most common and used ones, explaining what, when, and where to use them.
1. Moving Averages (MA)

The Moving Average indicator smooths out the price data and identifies trends based on calculating the average price over a specific time frame. Also, this indicator can take two forms:
Simple Moving Average (SMA): Calculate the average price over a specific time equally;
Exponential Moving Average (EMA): This type is more responsive to market movements and conditions that apply weighting factors, which decrease exponentially.
When to Use Moving Averages?
To identify the overall trends means that when the price is above, it means an uptrend, compared to below, which translates to a downtrend.
To identify potential buy or sell signals, you could check out the Moving Average Crossovers, which can happen when the short-term MA moves above or below the long-term MA.
For looking at the support and resistance levels, moving averages can be the dynamic trajectory of the price movements that bounce off.
2. Relative Strength Index (RSI)
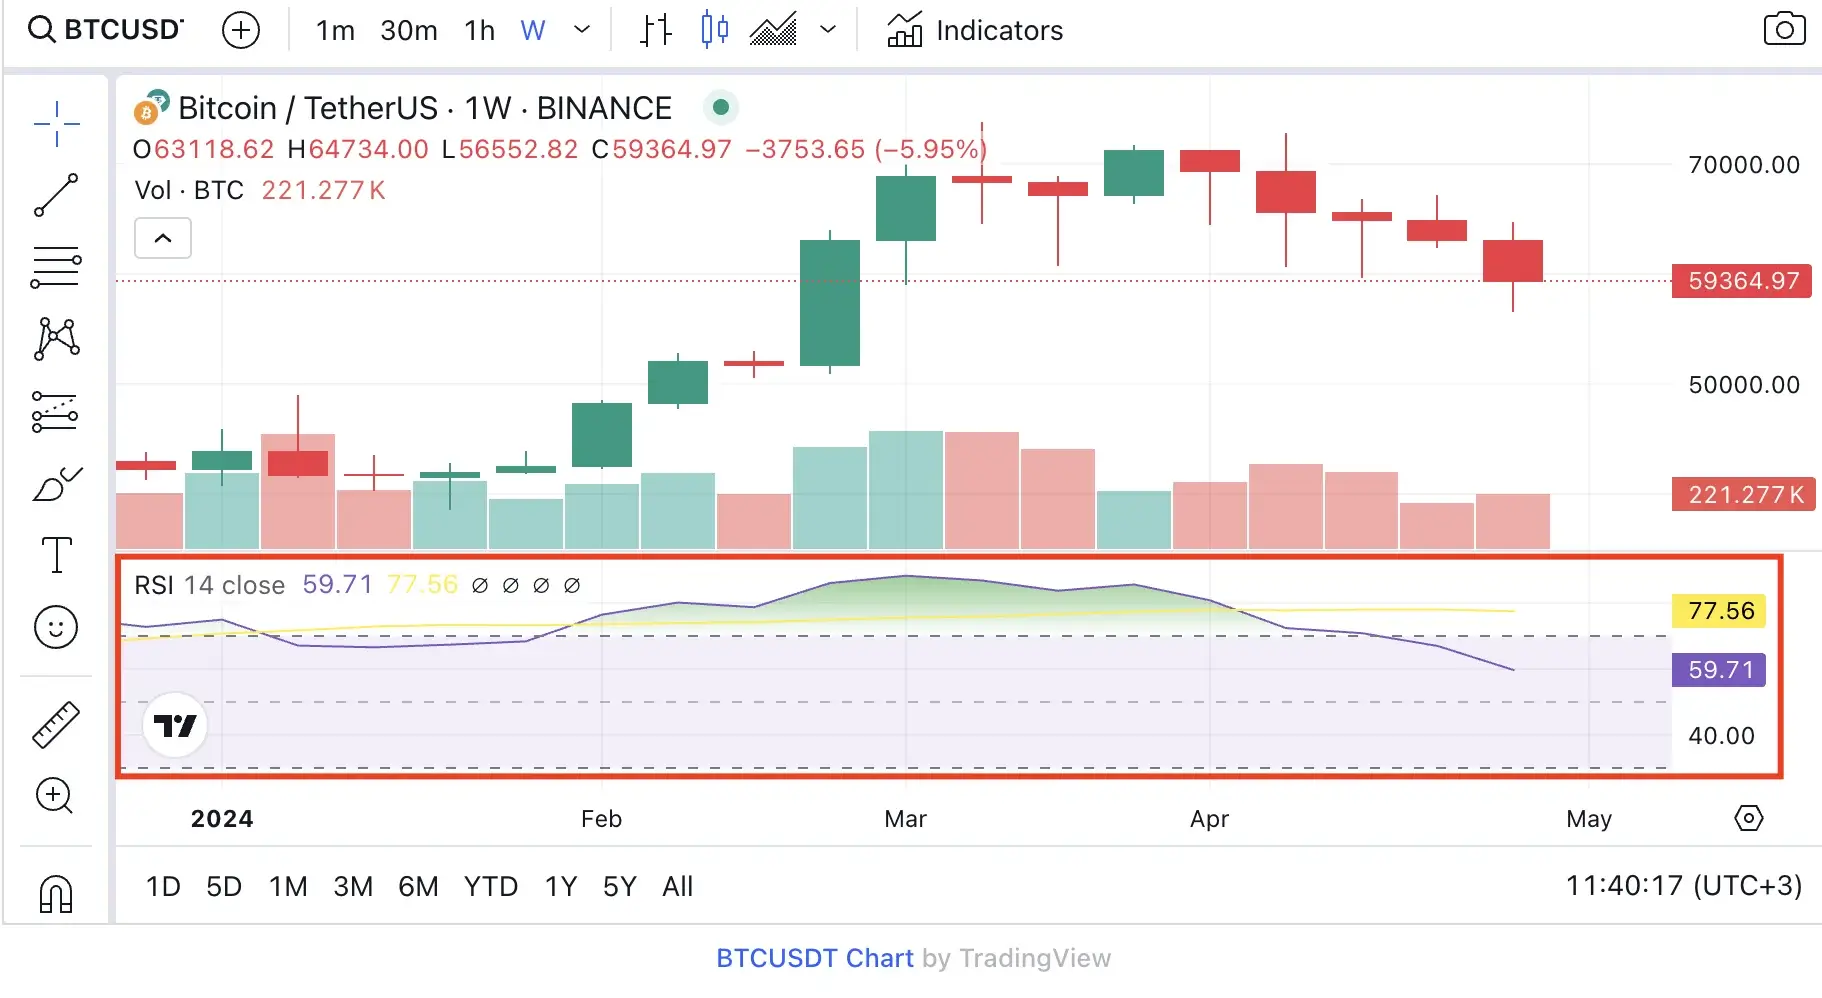
Here’s a robust technical indicator that helps you measure the speed and change of the price movement, which can vary from 0 to 100. By using the Relative Strength Index (RSI), you can look at market conditions and understand when cryptos were “overbought” and “oversold”.
For example, if the value is over 70, it means crypto is overbought, meaning the crypto market could be due to a correction, while anything below 30 is oversold.
3. Moving Average Convergence Divergence (MACD)
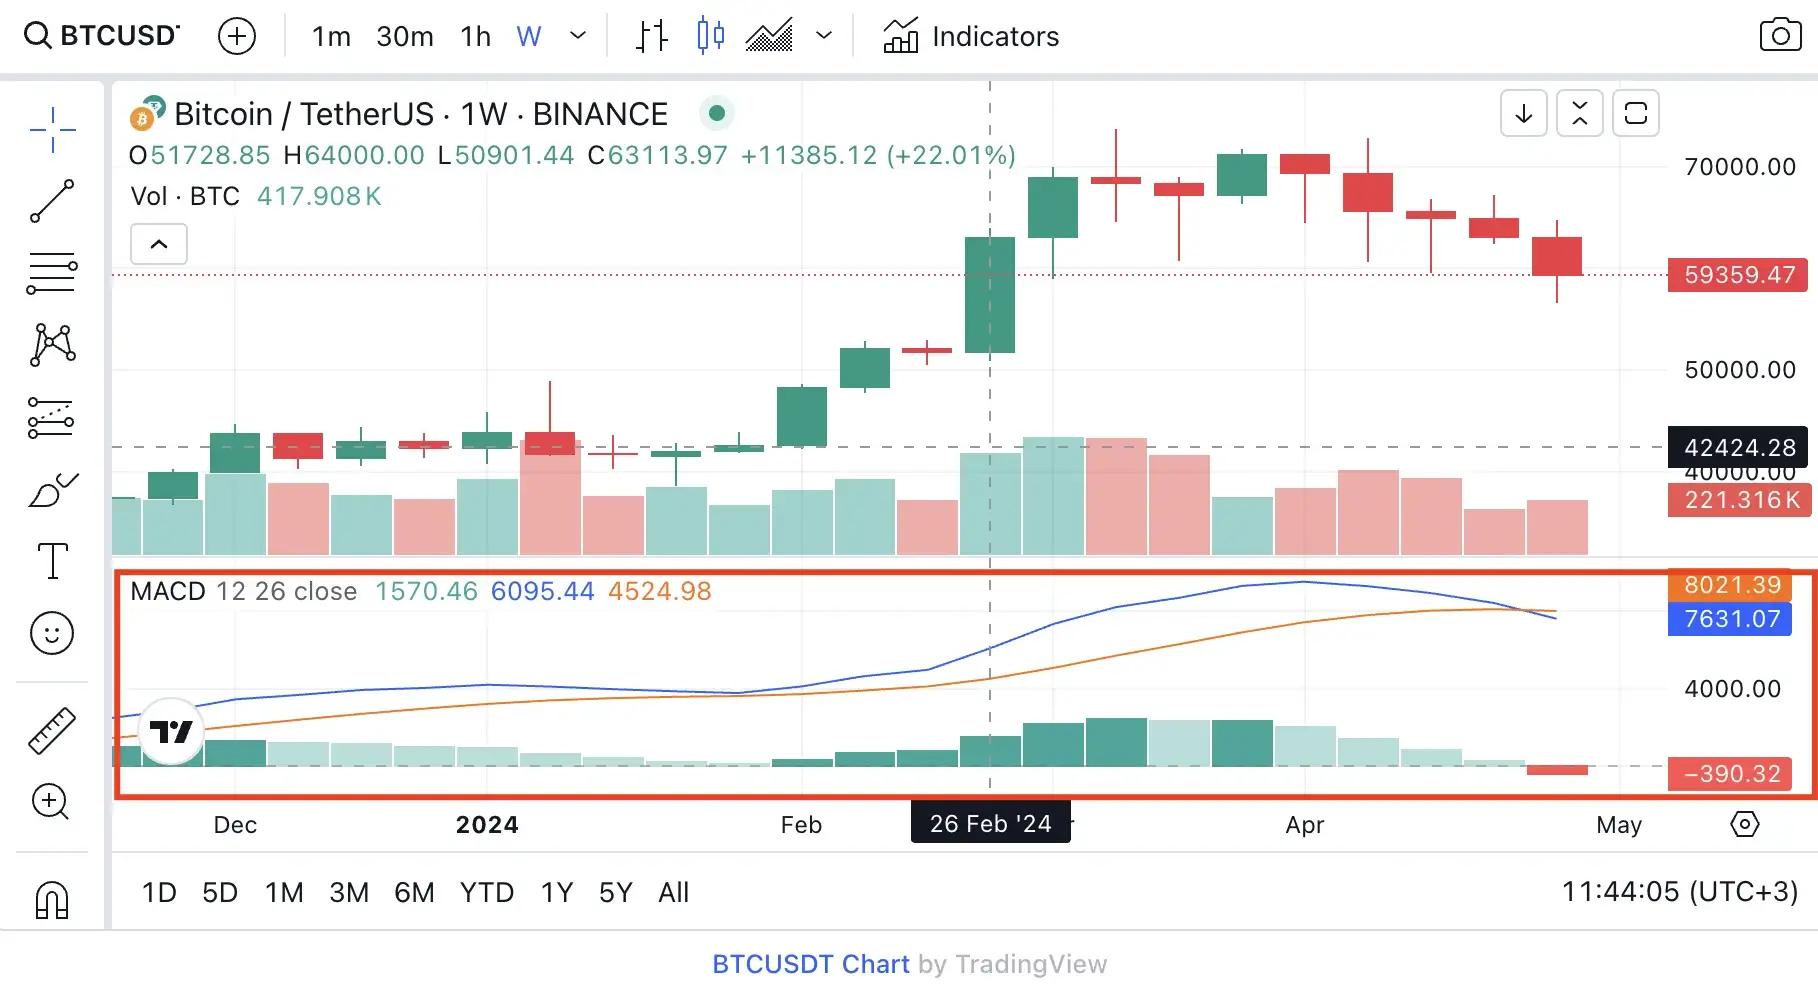
As you can see within the picture, the Moving Average Convergence Divergence acts upon the trend-following momentum indicator, whereby one line represents the MACD. At the same time, the other is the signal line.
The MACD line is the difference between two exponential moving averages, while the signal one is the average of the MACD line charts. The must-know aspect of these two is the crossover between them, which signals the buy or sell momentum.
4. Fibonacci Retracement
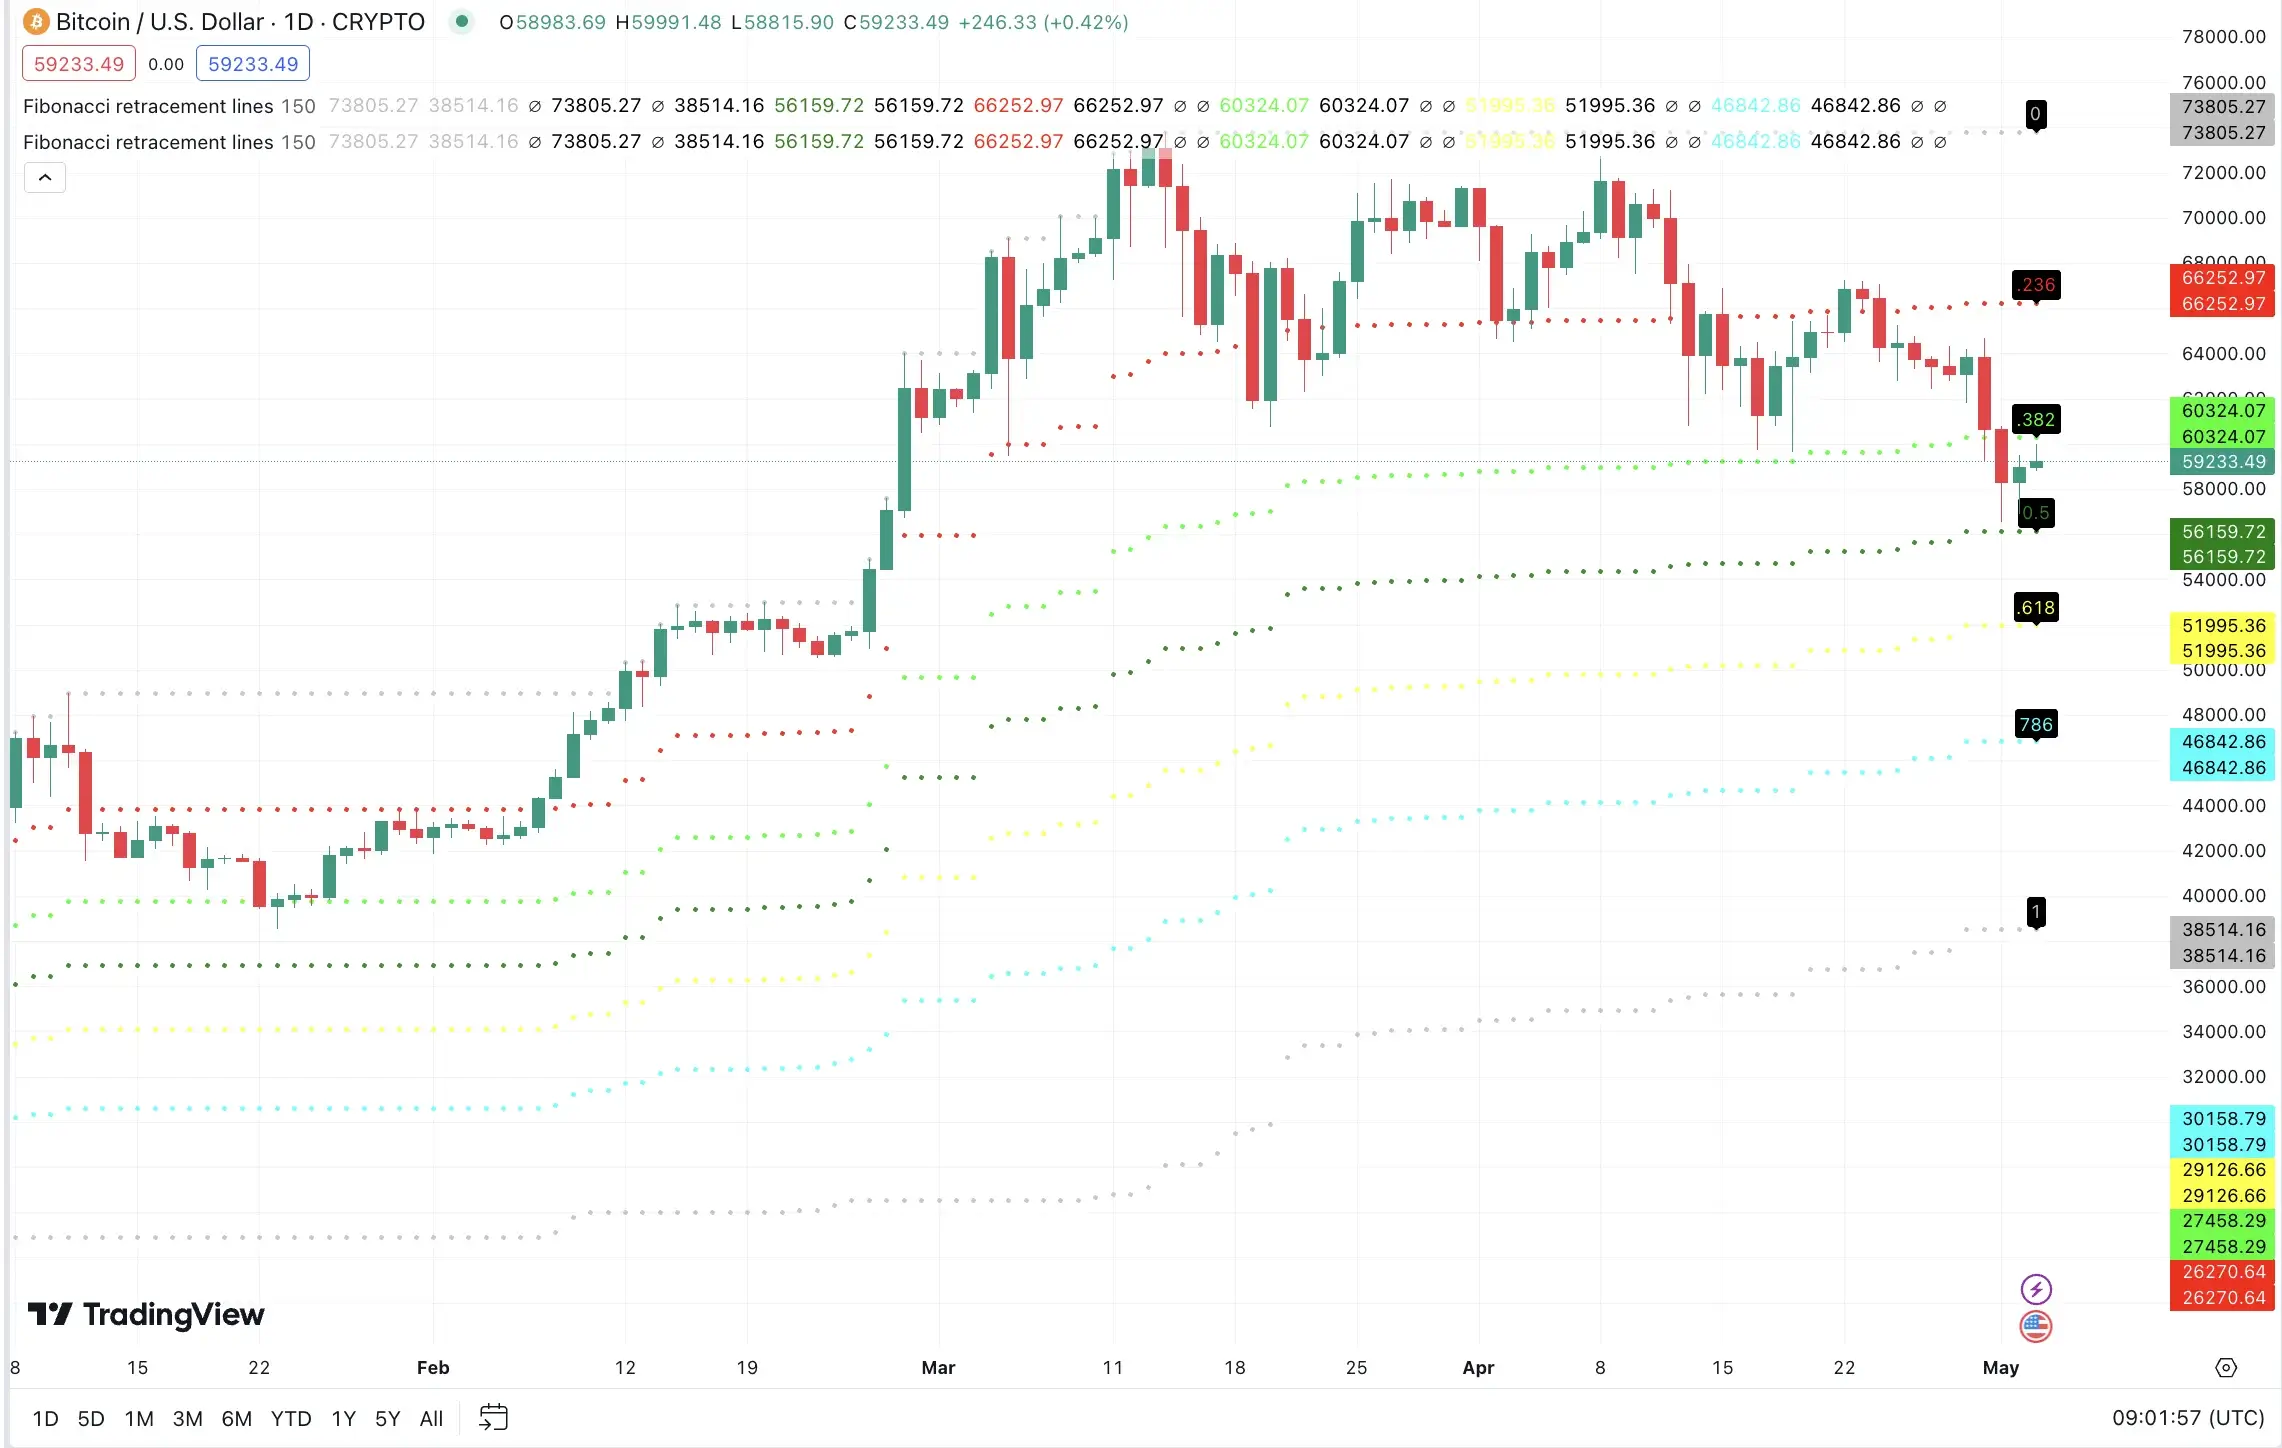
Based on the Fibonacci ratios, this indicator uses (the dotted) lines to look up potential support and resistance levels. The Fibonacci ratios derive from math sequences whereby each number is the sum of two preceding numbers.
5. Bollinger Bands
Bollinger Bands refers to a simple moving average and two standard deviation bands plotted above and below the moving averages, measuring the price volatility. Furthermore, when the price is within the bands, it means a range-bound market and the outside breakout means a trend reversal or a strong momentum.
But allow us to explain better the Bollinger Bands elements. The middle band is the simple moving average, also know as the baseline or centreline. The upper one is the limit, the resistance level in which the prices have a higher chance of reversing or facing selling pressure.
Lastly, the lower band is the lower limit, as you guessed. At this point, prices have a big chance of bouncing back or increasing buying pressure.
Therefore, Bollinger Bands helps investors identify support and resistance levels, expanding and contracting based on market data and volatility while spotting price breakouts.
As you can see, crypto chart technical indicators can alleviate an investor’s crypto trading process and journey. However, knowing which one to use heavily depends on your desired outcome and experience. From the top of our minds, our recommendation is to look for crypto guides that could shine a light on how to read crypto charts and adopt advanced crypto trading strategies.
Understanding Technical Analysis
Technical analysis is a crypto tool or method used to forecast a cryptocurrency pair’s probable future price movements through chart patterns, forming trendlines, price consolidation, and breakouts based on past trading activity.
But what is the link between technical analysis and crypto charts?
To perform your technical analysis, you must read the crypto trading chart, as they are both dependent on one another. By looking at historical data on the price movement of crypto, you could forecast the direction of the price based on the market trends and the sentiment of market participants.
Furthermore, technical analysis tools can be used in stock markets, indices, commodities, and other tradable instruments, including cryptos.
A Brief Technical Analysis Incursion & The Dow Theory
The term technical analysis was coined by Charles Dow, the founder and editor of the Wall Street Journal and the co-founder of Dow Jones & Company, responsible for the first ever created stock index, the Dow Jones Transportation Index (DJT).
Why is it essential to know the man behind technical analysis?
Well, its preachings are still used today, also called the Dow Theory, which, through many years of research, ended up including the patterns and signals we all know and use today.
Let’s discover more about the Dow Theory and see which principle it operates on.
1. The Price of the Assets Incorporates All Information
Since the market incorporates all available information about an asset into its price, this includes details like the asset’s profit potential.
2. The Primary Market Trends
As we all know, the bull and bear markets are the main ones, followed by the secondary trends against the primary ones, including the corrections in bull markets and rallies in bear markets.
3. The Primary Trends Phases
The primary trends follow three phases: the bull markets are set to experience accumulation, public participation, and excess stages. The bear markets will have the distribution, public participation, and panic stages.
4. Market Indices Must Corelate Between Them
Ones market index must be consistent with the signals from another market trend. It cannot be one signal upward price movements and the other one downtrend, either one or the other, but both corresponding.
5. The Market Trend and the Trading Volume Ratio
The rule is this: if it’s a bull market, then the trading volume should increase, and vice-versa for the bear market. If there’s a decrease in the volume of a bull market sentiment, it could be a bearish movement that often leads to a bear market sentiment.
6. Persisting Trends Until A Turnaround
It is said that crypto market trends will continue until a disruption occurs.
Candlestick Charts Basics

The crypto candlestick charts are visual representations of the trading activity for any given crypto asset, offering extensive details such as the opening and closing prices and the price movement data of a digital asset in both the long and short term time.
Each candlestick chart is presented through a visual graph that shows the price data. As such, the vertical axis represents the price, while the horizontal axis shows the time frame.
The top and bottom of each candle represents the asset’s opening and closing price, within the time frame, and this is especially important for traders looking for the best crypto for day trading, as it shows whether the price action is bull flag or a bear flag.
If we look at automated crypto trading tools, we can understand that they quickly analyze extensive amounts of trading data while generating candlestick charts in real time. Therefore, crypto traders could make informed decisions based on their identified price trends.
Another aspect is the color of the candlesticks since they represent the opening price and which one is the closing price. If there’s a price increase, the candle will be green, also known as the bullish candle, whereby the bottom of the body is the opening price, and the top is the closing price.
On the other hand, if the candle is red, it shows a price decrease for the said amount of time; it is a bearish candle, meaning that the top of the body is the opening price, and the bottom of the body is the closing price.
Now, let’s move on to the candle wick, also known as the tail, which consists of the thin line above and below the candlestick’s body, representing the highest and lowest crypto price in a set period.
Given the candlestick charts with their colors, bodies, and wicks, traders can now analyze and identify potential trends, patterns, and market sentiment, but let’s find out some of the most common candlestick patterns.
3 of the Most Common Candlestick Patterns
1. Doji Candle Pattern
The doji candle pattern appears when the open and close prices are very close, visually resulting in a candle with no body. This pattern suggests the crypto market indecisions and a potential trend reversal.
2. The Hammer
Just as the name says it, the hammer has a small body on the top side, with a long lower wick, and it shows potential bullish reversal after a downtrend.
3. The Shooting Star Pattern
The shooting star is similar to the hammer but inverted, with a long wick at the top and a small body near the bottom. Usually, such a pattern shows a potential bearish reversal after an uptrend.
As these are just some examples, there could also be the Abandoned Baby Top/Bottom, the Three Black Crows, and many more.
Finding Crypto Charts Patterns
As we’ve reached this far, you can now identify, analyze, and understand the elements of a crypto chart, in which even the candlestick charts tell you the story of a cryptocurrency. This approach is essential, as your trading strategy heavily depends on it, as it shines a light on how the market’s price movement of a particular asset performs.
Moreover, since there are numerous charts, price points, and candlestick patterns, one thing is clear: there are no cookie-cutter patterns. Instead, you could turn your attention to some key trading concepts and what they mean for your trading strategy.
The Support and Resistance Levels
Support and resistance levels are some of the most used notions in any trading approach. The support level represents the floor price or the level at which crypto maintains its price.
In contrast, the resistance levels mark the level of a crypto that cannot move past that price point, also known as the ceiling.
To make meaning of the support and resistance levels, traders use trendlines to connect the asset’s price. Depending on the trajectory, upwards or downwards, it could signify a higher demand or vice versa.
How do we identify the support and resistance levels? Moving averages provide an average price for a particular crypto in a specific time frame.
Crypto Charts Drawbacks
Often, traders strongly believe that crypto charts predict future price movements when in reality, there are possibilities that might happen, as crypto chats are not an exact science.
Furthermore, over-indulging in crypto charts and candlestick charts isn’t always the key to a greater trading strategy, as it could lead to confusion and even contradiction.
This leads us to this: learn, read, and use the crypto charts and candlestick patterns to your advantage, but take them as they are, with their purposes, values, and limitations.
FAQ
How to Read Crypto Charts?
By understanding the support and resistance levels, you have now unlocked the key to how to read crypto charts. As such, the support level is when the price of assets doesn’t fall below, and the resistance level means the price isn’t expected to rise in a set time frame.
How to Read Crypto Charts for Day Trading?
Day traders can use multiple technical analysis tools, like chart patterns, trading signals, and indicators, to make informed decisions. However, only betting on the tools isn’t the way, as learning risk management, such as setting stop-loss orders, could increase your chances for a successful day trading strategy.
How to Read Crypto Candlestick Charts?
In short, the candlestick charts showcase an asset’s opening and closing price for a specific time, while the wick means the highest and lowest price. Moreover, green candles mark a value gain, and red represents the value’s loss.
Conclusion
As you’ve unlocked the secrets to reading crypto charts like an expert, you’ve grasped the basics of price movements, technical indicators, and candlestick patterns and even ventured into the world of technical analysis.
Remember, crypto charts are powerful tools but shouldn’t be your only guide. Combine this knowledge with risk management practices and a dash of intuition to navigate cryptocurrency’s exciting, ever-changing world.
So, are you ready to put your newfound skills to the test? Dive into the crypto market confidently, and remember to keep learning and exploring.

With over 6 years of experience in the world of financial markets and cryptocurrencies, Teodor Volkov provides in-depth analyses, up-to-date news, and strategic forecasts for investors and enthusiasts. His professionalism and sense of market trends make the information he shares reliable and valuable for everyone who wants to make informed decisions.