The cryptocurrency market is known for changing a lot, which can be good for traders to make money, but it can also be risky. To stay safe and make the most of it, traders need to learn some advanced strategies. In this article, we’ll focus on three of them:
- Technical Indicators: Using a tool called VWAP to decide when to sell.
- Candlestick Patterns: Using special patterns in the price charts to make smarter trades.
- Confluence Stop-Losses: Adding extra protection to your trades.
Strategy 1: Technical Indicator Only
To succeed in trading, one needs both a perfect entry and an optimized exit strategy. This is where the VWAP (Volume Weighted Average Price) Selling Strategy combined with Heikin Ashi candles shines.
VWAP, which stands for Volume Weighted Average Price, is essentially an average price. However, distinct from traditional averages that solely consider the time factor, VWAP incorporates trading volume as a pivotal component in its calculation. This inclusion endows you with a more robust measure for assessing true market sentiment and price trajectory.
VWAP is represented as a single line on trading charts, typically displayed as a continuous line running through the chart’s price data. In the chart below, it is represented as a blue line for easy visibility. You can use this line to assess whether current prices are above or below the average price weighted by trading volume.
VWAP offers an insight into the average price a security has traded at throughout the day, based on both volume and price. The GME stock serves as a perfect illustration. After spotting a breakout, the Heikin Ashi candles’ color change serves as a validation of bearish momentum. The continuous monitoring of VWAP levels and adjustments ensures that traders remain aligned with the market’s pulse.
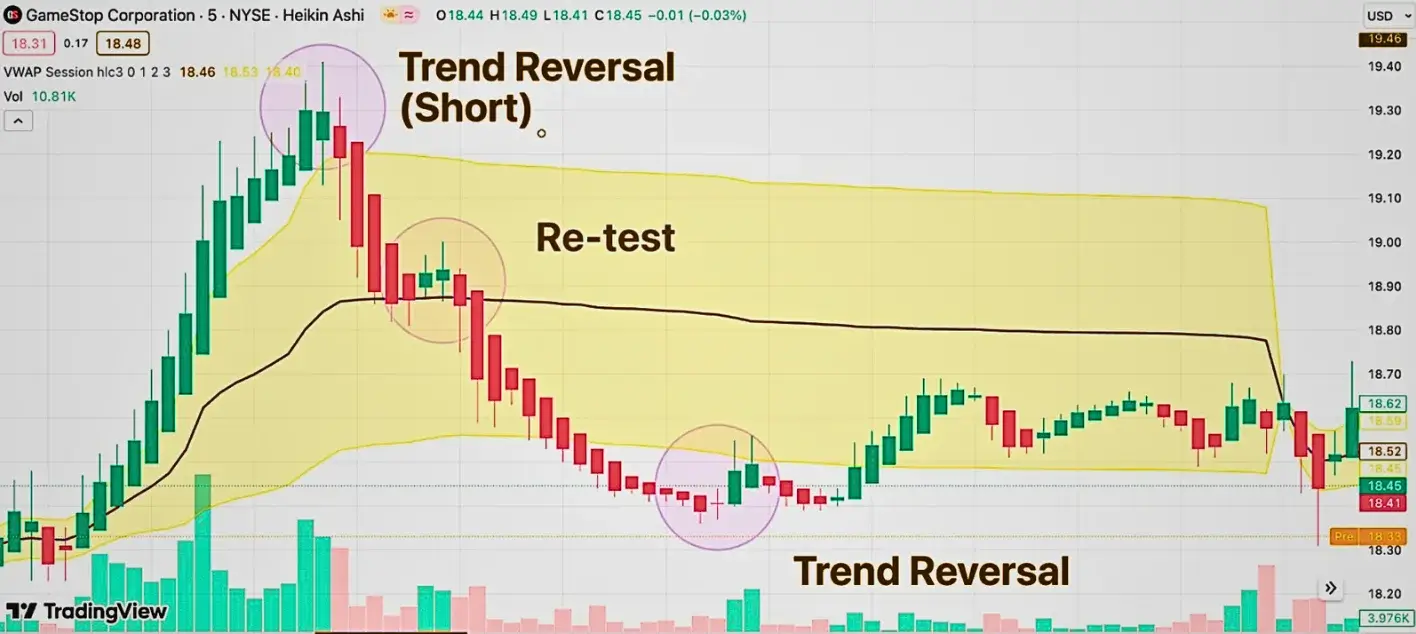
Key Trading Rules:
- Identify breakouts and look for significant volume spikes.
- Validate your observations using Heikin Ashi candles.
- Monitor price retracement to the VWAP level.
- Stay vigilant during retests; any volume decline is a sign of seller domination.
- Regularly adjust stop losses in line with the VWAP.
- Exit trades based on Heikin Ashi and VWAP convergence insights.
Strategy 2: Candlestick Patterns & Technical Indicators
Experienced traders can tell when a price is just moving around or when it’s showing a strong trend. To do this, they use a combination of two tools: Candlestick patterns and technical indicators. In this case we will look at a strategy involving the Dark Cloud Cover Pattern and technical indicators such as the Parabolic SAR and the Moving Average with EMA Cross.
Parabolic SAR is like a set of dots that appear above or below the price bars. These dots help identify potential points where the price might change direction. They move closer to the price as the trend gets stronger, making them useful for setting stop-loss orders.
The Moving Average with EMA Cross strategy combines two types of moving averages. One has a shorter time period, and the other has a longer time period. When the shorter one crosses above the longer one, it means there’s a good chance of the price going up (bullish trend), and when it crosses below, it suggests the price might go down (bearish trend). It’s a simple and popular strategy for deciding when to enter or exit a trade.
For example, when looking at a chart for a commodity like CORN, you might see a pattern called the Dark Cloud Cover. This pattern often suggests that the trend might change. Parabolic SAR, with its dots, can help you figure out how strong the trend is. If the dots are above the candle, it’s a sign that the price might go down. The Moving Average with EMA Cross is all about how two moving averages interact. When the shorter one goes above the longer one, it’s a signal that the price might go up, and when it goes below, it suggests the price might go down.
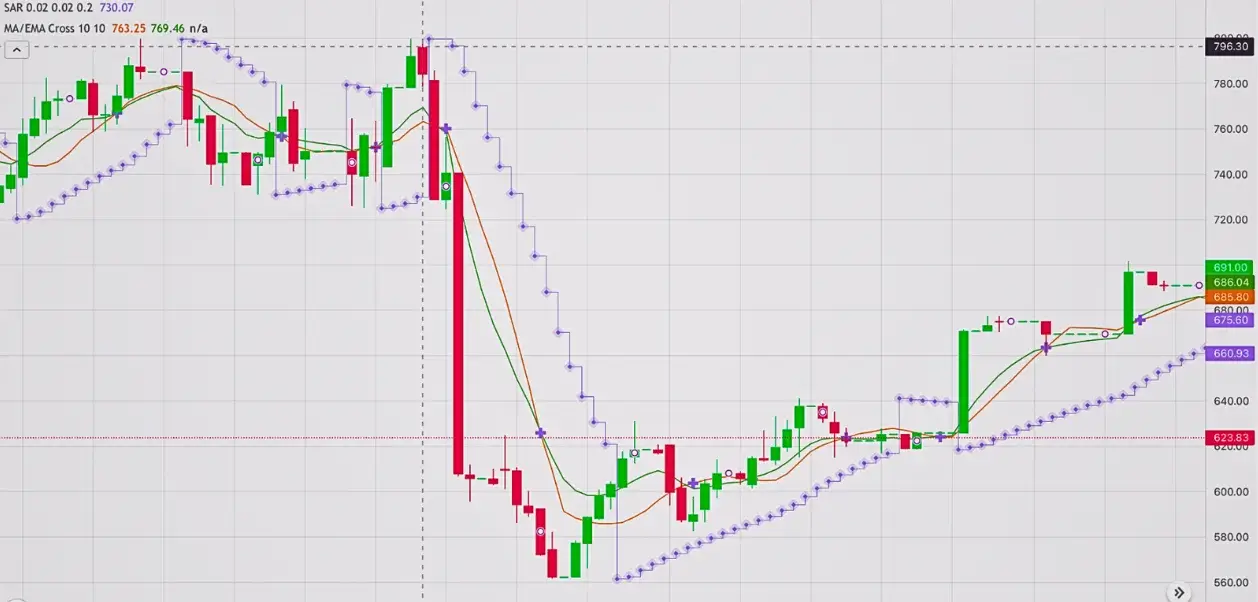
Key Trading Rules:
- Seek the Dark Cloud Cover pattern, especially when the market is sideways.
- Ascertain the Parabolic SAR dots’ placement above the candle.
- Monitor the EMA cross; a downward cross is your cue.
- Initiate a short position, aligning with the aforementioned indicators.
Strategy 3: Confluence Stop Loss
In trading, protecting your capital is as crucial as making profits. The Confluence Stop Loss strategy ensures traders set a robust stop-loss by utilizing insights from multiple technical indicators.
Using Bitcoin’s 5m chart as our backdrop, we see the magic of combining Bollinger Bands and MACD. Bollinger Bands measure price volatility by plotting a central moving average with two standard deviation bands above and below it. MACD (Moving Average Convergence Divergence) indicates trend momentum and potential buy/sell signals by comparing short-term and long-term moving averages.
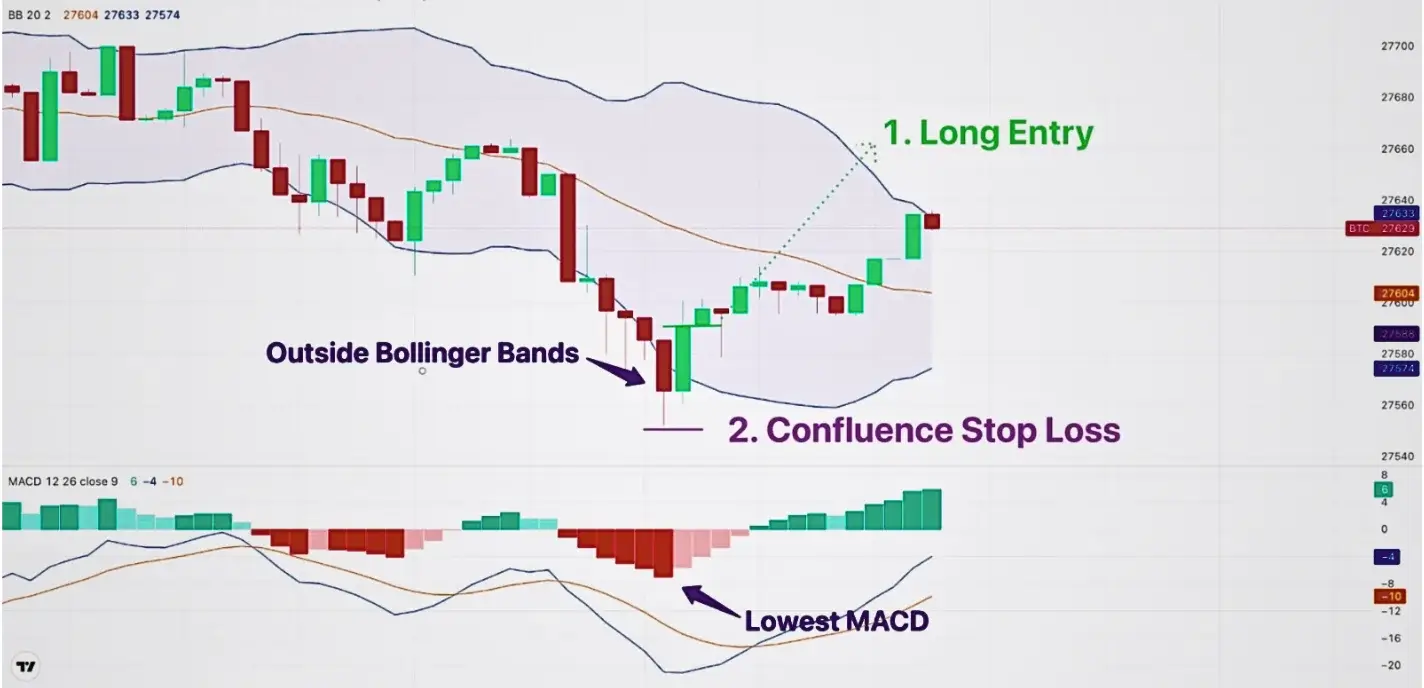
Bollinger Bands measure price volatility by plotting a central moving average with two standard deviation bands above and below it.
MACD (Moving Average Convergence Divergence) indicates trend momentum and potential buy/sell signals by comparing short-term and long-term moving averages.
Key Trading Rules:
- Identify a potential entry, such as a bullish Tweezer Bottom.
- Look for candles outside the Bollinger Bands.
- From those candles, determine where the MACD marks its lowest point.
- Place your stop loss just beneath that candle.
- By amalgamating these indicators, traders can set more precise stop-loss points, reducing the risk of false knockouts and enhancing trade security.
Conclusion
To do well in crypto trading, a trader needs to keep learning and using advanced strategies. The methods we’ve talked about cover everything from when to start a trade to how to manage risks. But it’s crucial to remember that while these strategies are helpful, it’s also important to do your research and keep on learning. This is how traders keep getting better at what they do.