There are numerous reasons why crypto trading has become so popular. If it weren’t for all the traders who made significant profits through this activity, we would have put it to sleep long ago. However, it works, and when performed right, crypto trading can have surprising results. Otherwise, we would not see a 1-day trading volume of nearly $100 billion.
So, considering that we have just come out of a crypto winter, and things start to get back to normal, you might have considered learning more about crypto trading and even putting your funds to work.
If this is the case, you surely know that you cannot simply trade crypto without analyzing market trends and having at least basic trading knowledge.
The crypto market is still highly volatile, and a wrong move can lead to significant losses. The good thing is there are some technical analysis patterns you can follow to make informed trading decisions. In this article, we will talk about bull and bear flags, some of the most popular continuation patterns in the field.
Crypto Trading, Shortly

Crypto trading implies speculating in the price movement of a cryptocurrency through a CFD trading account or buying and selling crypto on a specialized exchange. There are multiple styles of crypto trading, just like there are for regular stock trading.
For instance, you can work with day trading and exit positions within the same day. This can bring you faster profits and fewer risks, as your funds cannot be affected by overnight market fluctuations. However, faster profits also mean that you can lose funds faster if you don’t follow a well-thought-out strategy.
Also, you can choose swing trading and follow short-term trends, but this type of trading might be recommended for more experienced traders. With swing trading, you can make more informed decisions, and believe it or not, it takes less time to perform swing trading than day trading. All you need is discipline and a good trading strategy.
Another popular trading style is called position trading, but it is also known as “trend trading.” Position trading implies purchasing tokens and holding them for longer periods of time. This type of trading might be easier to learn, but you will get rather long-term profits, so don’t expect to earn profits right after you start trading.
What Is a Bull Flag Pattern?

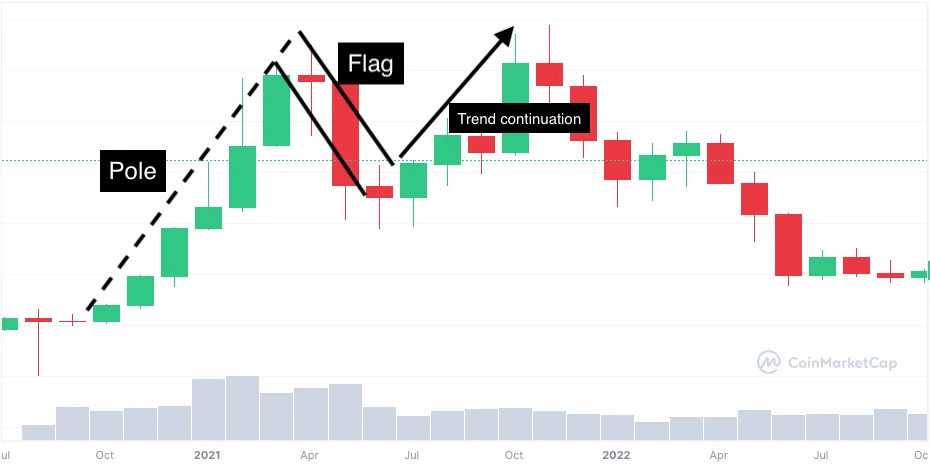
A bullish flag is a continuation pattern that occurs when the price of a cryptocurrency has a sudden increase, followed by a period of consolidation and a possible trend continuation. The pattern is considered to be bullish because the flag suggests that there might be followed by an increase in price.
The bull flag chart pattern formation is characterized by parallel trend lines encapsulating the consolidation phase. The upper trend line acts as resistance, while the lower trend line functions as support.
Bear flag chart patterns have 2 main components: a pole and a flag. The pole is represented by a significant price surge that ends when a consolidation period begins. The consolidation period usually has lower prices, but the price change is not so high.
The flag portion of the pattern is generally sloping against the prevailing trend, showing a series of lower highs and lows. This pattern essentially represents a brief period of profit-taking before the bullish trend regains control.
During the formation of a bull flag, it’s common to observe a decline in trading volume. This decrease signals a change in market activity during the consolidation, indicating a potential calm before a new surge in buying interest.
The breakout point is a critical aspect for traders, occurring when the price breaks above the upper trend line. A breakout with increased volume is often interpreted as a bullish signal, offering traders a potential entry point to capitalize on the anticipated continuation of the upward trend.
The consolidation period (or flag) precedes a bullish trend continuation, which is a period when the price continues its trend from before the consolidation phase. Thus, in a bullish flag pattern, the trend continuation implies that the price increases.
Example of Bull Flag Pattern
A good example of a bull flag pattern is Bitcoin’s evolution in 2021, right before hitting its all-time high. The price first rose surprisingly, being followed by a period with a downward trend. After a couple of months of being on the bearish side, Bitcoin went back up.
How to Trade Bull Flags?
Trading bull flags in the crypto market involves a strategic approach that combines technical analysis and well-defined entry and exit points. To initiate a trade based on a bull flag formation, traders typically start by identifying the pattern on the price chart. Of course, it is recommended to look at the candlestick patterns rather than just using a simple price evolution.
Users should recognize the characteristic flag pole, the consolidation period, and the parallel trend lines that define the bull flag pattern. They might use technical indicators like the RSI (Relative Strength Index) to confirm the strength of the trend during the consolidation phase.
The breakout entry point is the next thing you should look for when trading bull flags. Traders aim to enter a position when the price decisively breaks above the upper trend line of the flag and the trading volume experiences an increase.
The breakout point serves as a confirmation of the pattern and is considered a great moment to invest, anticipating a continuation of the upward trend. Furthermore, setting a profit target is also essential, and you can calculate it by measuring the height of the flag pole and adding it to the breakout price.
Risk management is paramount when trading bull flags, so you should also set a stop-loss order below the lower trend line of the flag pattern. This will help mitigate potential losses in case the breakout fails or the market experiences unexpected fluctuations.
You should always be aware of the possibility of false signals and use additional technical analysis tools to validate the strength of the pattern. Furthermore, keep an eye on market trends, crypto news, and the overall market conditions, as they might help you adapt your trading strategy to the dynamics of the crypto market.
What Is a Bear Flag Pattern?
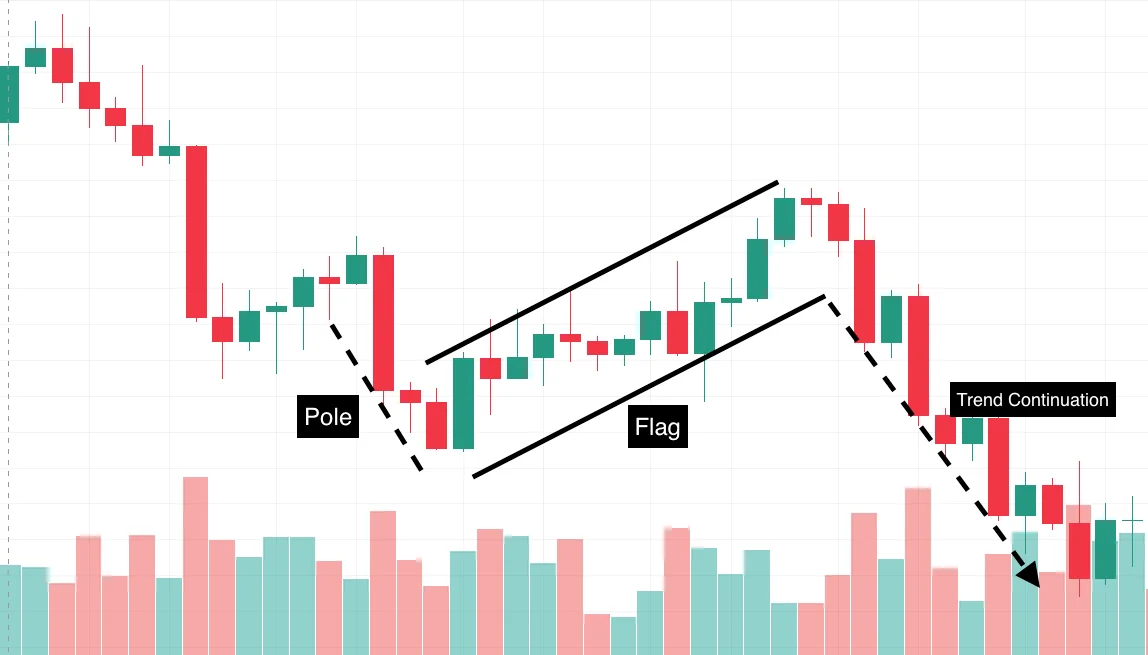
The bear flag chart pattern is a significant technical indicator, being considered a precursor of a prevailing downward trend. Simply put, the bull flag and bear flag patterns are somehow similar; only bull flag patterns have their flag pole indicating a downtrend, while bear flag patterns are just the other way around.
A bearish flag pattern usually occurs after a sharp and rapid price decline, forming the flag pole and then a consolidation period characterized by a flag. Just like the bull flag pattern, the bear flag involves parallel trend lines, with the upper trend line acting as resistance and the lower one being the support line.
During the formation of a bear flag pattern, traders usually monitor the trading volume. A decline in volume during the consolidation phase may be often noticed, showcasing a reduction in market activity and a temporary pause before a potential further downward trend.
In case of a bear flag pattern, traders might also rely on technical analysis and the Relative Strength Index to measure the strength of the bearish trend during the consolidation. The breakout entry point is the moment technical traders are looking for if they want to capitalize on the continuation of the downtrend. This breakout point occurs when the price breaks below the lower trend line.
Example of Bear Flag Pattern
A good example of a bear flag pattern is Bitcoin’s evolution in January 2018, when it experienced a sudden price drop, thus forming a bear flag. The consolidation phase confirmed the bearish sentiment, and when the price broke below the lower boundary, it showcased a continuation of the decline.
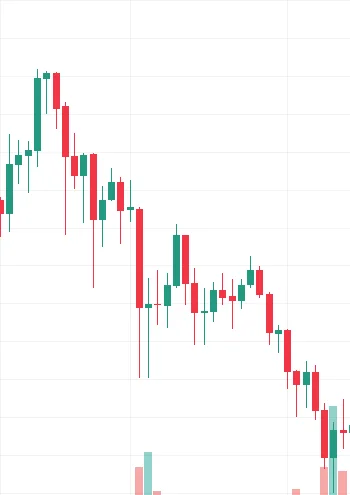
A similar situation occurred in September 2020, when Ethereum experienced a sudden price drop that formed a bear flag during a period of market uncertainty.

How to Trade Bear Flags?
Trading bear flags requires well-defined trading strategies, combining various elements of technical analysis and risk management. To trade based on a bear flag pattern, you should start by identifying the formation on the price chart. This involves noticing the flag pole, followed by the consolidation period that takes the form of the flag, and the continuation trend.
Of course, you should also identify the breakout entry point, and once you do this, it is recommended that you calculate the profit target. To do this, measure the height of the flag pole and project a proportionate distance from the breakout level.
Furthermore, don’t forget to set a stop-loss (or failure) level. This can be represented by a price move below the support of the flag formation. Setting such levels and targets is essential in what concerns risk management.
Besides, try to consider as many factors as possible, as the crypto market can be affected by numerous factors that are not related to candlestick patterns and bull and bear flag formations.
Bull Flag vs Bear Flag – Comparison

Both bull and bear flags are key chart patterns that can help traders anticipate potential price movements. While the 2 patterns share common elements, such as the flag pole and the parallel trend lines, they differ much in their implications for market direction.
The bull flag pattern occurs after a strong upward trend, forming a flag that signals a temporary consolidation of the price that contains lower prices and trading volumes and can reflect a temporary pause in the market.
In the case of a bull flag, traders should look for a breakout entry point when the price rises above the upper trend line, confirming the bullish movement.
On the other hand, bear flag patterns occur after a surprising downward price movement that forms the flag pole. The flag pole is then followed by a consolidation period where the flag appears, usually (but not always) followed by a continuation pattern of the downtrend.
The breakout entry point of a bear flag may appear when the price falls below the lower trend line, sometimes being combined with a slight increase in trading volume.
The main difference between bear and bull flags is represented by their implication for market evolution. Bull flags showcase a potential price increase, while bear flags suggest a continuation of a downtrend. Each type of flag pattern requires different strategies and approaches.
FAQ
Is a bull flag pattern good?
Yes, a bull flag is usually considered favorable for traders looking for trading opportunities. The pattern suggests that the price might continue to increase, and such a movement can intrigue traders and encourage them to enter long positions.
Can a bull flag fail?
Unfortunately, yes. Like any technical analysis pattern, a bull flag can fail. False breakouts and unexpected market events can lead to the failure of such patterns. Try to stay informed so that you are not affected if a bull pattern fails.
How reliable is a bear flag pattern?
The short answer is that it depends. While bear flags can provide useful signals for potential downward movements, traders should also consider market conditions, volume analysis, and overall trend strength. It is also essential to use additional technical indicators, thus increasing the reliability of the bear flag.
How to trade flag patterns?
Trading flag patterns involves identifying the pattern on the price chart, waiting for a breakout, and then entering positions accordingly. For bull flags, you might want to look for a breakout above the upper trend line, while for bear flags, you should wait for a breakdown below the lower trend line. Try to always set entry and exit points and stop-loss levels, and follow a solid risk management strategy.
What happens after a bear flag pattern?
After a bear flag pattern, if the breakout to the downside is confirmed, it suggests a potential continuation of the existing downtrend.
How long can a bull flag last?
The duration of a bull flag pattern can vary. Bull flags are usually short to medium-term patterns, lasting a few weeks, for instance.
In Conclusion
Understanding the implications of bull and bear flags is critical for almost any crypto trader, depending on their experience and knowledge. Such patterns combine risk management strategies with technical analysis, helping traders use their funds safely and, in some cases, increase their earnings.
It is essential not to base your trading decisions solely on bear and bull flag patterns. You should also consider market trends, news in the crypto industry, and other factors that might affect the price and overall evolution of the cryptocurrencies you are following or already trading.