How to Create a Binance Trading Bot
It goes without saying that the cryptocurrency market can be very volatile. The crypto market never sleeps, unlike conventional markets, and keeping track of it is comparable to working a full-time job. However, not everyone has the ability or desire to be hooked to their computers and smartphones in order to close a deal quickly.
So, what are your options, if you genuinely want to benefit from the volatility that the cryptocurrency market offers without turning it into a full-time job? The answer is simple: set up an automated trading robot!
In this article, we will provide you with a step-by-step tutorial about how to create a Binance trading bot on TradeSanta. So let’s dive in!
What are automated trading bots in Crypto Markets?
Automated crypto trading bots directly connect to crypto exchanges and place orders based on a predefined strategy. Their main advantages are efficiency, speed, very few errors, and, of course, emotionless trading.
The bots themselves represent software programs that operate according to implemented algorithms, as well as different filters like trading signals and technical analysis. TradeSanta has plenty of features to make automated crypto trading as fruitful as possible: stop loss, trailing stop loss, simple or trailing take profit targets, MACD, RSI, Bollinger, and TradingView Signals, just to name a few.
You can choose a strategy (Grid, DCA, DCA Futures, and Grid Futures trading bots), and the software will start making deals based on your preferences.
Since the bot operates by using market analytics and math formulas, it’s not affected by human emotions and works 24/7, while you can spend your time with family and friends or focus on your main job.
So what are the benefits of using automated trading bots?
Saves time
It’s all about managing your time. You have a life to live, so it’s not always possible to be glued to your laptop or smartphone 24 hours a day, 7 days a week. You can be distracted by something else and overlook the best time to buy or sell.
In this situation, bots can be really helpful. They can monitor the market around-the-clock, which can save you a lot of time. All you have to do is periodically check in on them and maintain or create new ones as necessary.
To close the deal at the best rate, you don’t need to place all of your orders manually – a trading bot can do that 10 times faster. No human being alive can trade at the speed of a computer program that can place several orders in a fraction of a second (one 64 millionth of a second in case of HFT bots).
Kills the routine
We all know that trading in the crypto market can be exhausting due to its extreme volatility, and it necessitates extensive research on current trends, market conditions, and forthcoming events in order to win more and lose less.
Automated trading bots can make your trading routine simpler. You do not need to place all your orders by hand to close the deals at the best time possible; let the bot do that on your behalf.
Keeps your head cool
Trading with cryptobots gives a more rational approach to trading. When you watch the chart go in the opposite direction from what you need, you unintentionally become emotional. When you trade emotionally, you lose since your carefully prepared methods and game plans go out the window, and you begin trading recklessly.
Cryptocurrency trading bots are emotionless and always execute the pre-programmed algorithm.
How to create an automated trading bot?
Now let’s move to how to create a crypto trading bot, but before that, let’s take a look at some preparations you need to do first.
Binance account and API
First, you need to create a Binance account in case you don’t have one. It is a pretty easy and straightforward process, so it won’t take you more than just a few minutes. You can register via Binance website, Binance App, or Binance Desktop App – whatever fits you best.
Even though we’re talking about Binance here, TradeSanta also supports Huobi, Coinbase, OKX, Kraken, Bybit, HitBTC, and xGo.
Once you’re done, you will be asked to complete your verification via a simple KYC process. All you need to do is a photo of your ID as well as a selfie, plus your phone number; the approval also takes just a few minutes, so you can be done with all the formalities in less than 10 minutes.
You might want to explore Binance a bit first if you have never tried it before and see what kind of products they offer.
Before we move to bots themselves, you need to get your API keys first. To create your API, do the following:
- Go to your profile and look for the API Management page. Enter your new API key name and click “Create.”
- Binance will then ask you for the code from your email as well as the code from your authentication app. Enter these codes and click “Submit.”
- The new API key is now created, and you are good to go.
TradeSanta’s crypto trading bots
Now let’s move to TradeSanta and see how you can create a bot that will automatically trade on Binance on your behalf.
Register on TradeSanta website first if you don’t have an account yet.
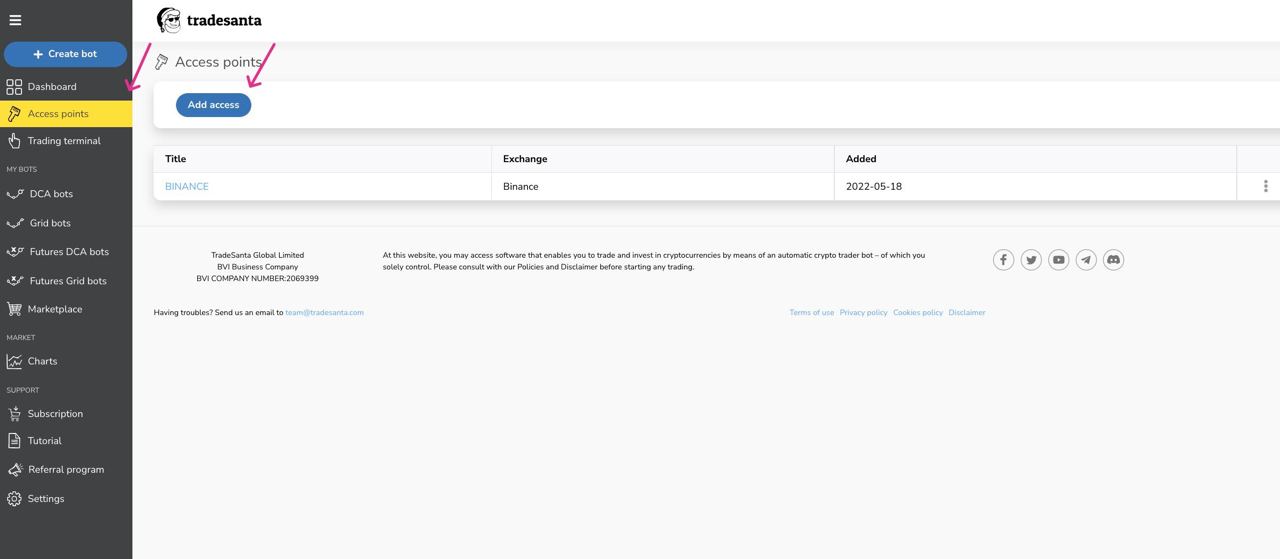
Once you’re logged in, find the “Access points” section in your left menu, and click on the “All accesses” suboption, to enter your access points list. Click “Add Access” to create a new access point, then copy and paste the API keys you’ve created on Binance.
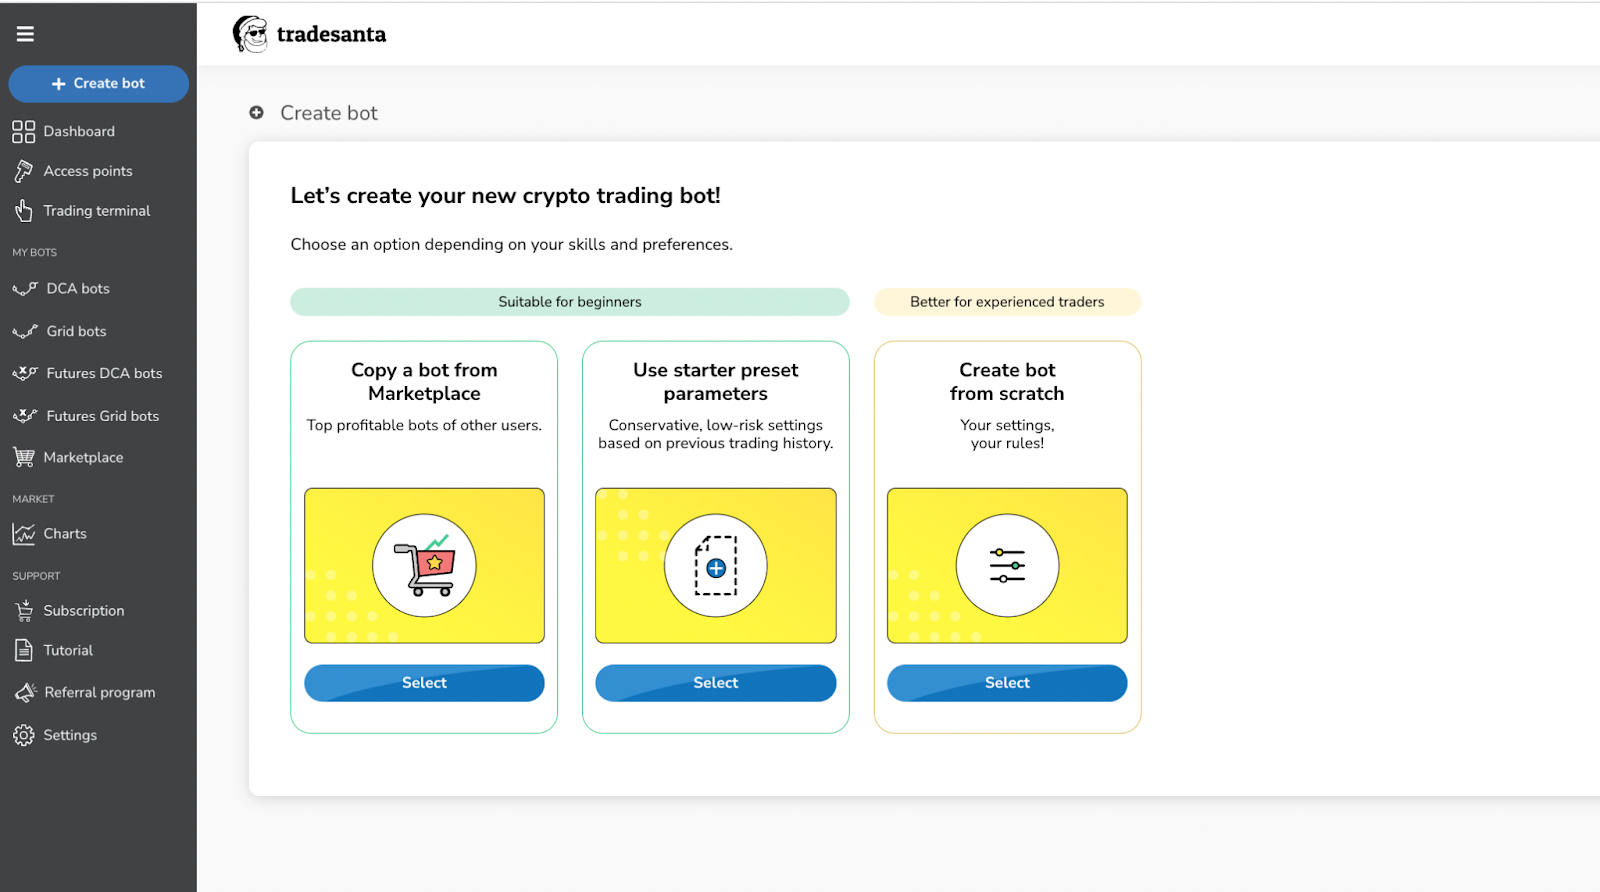
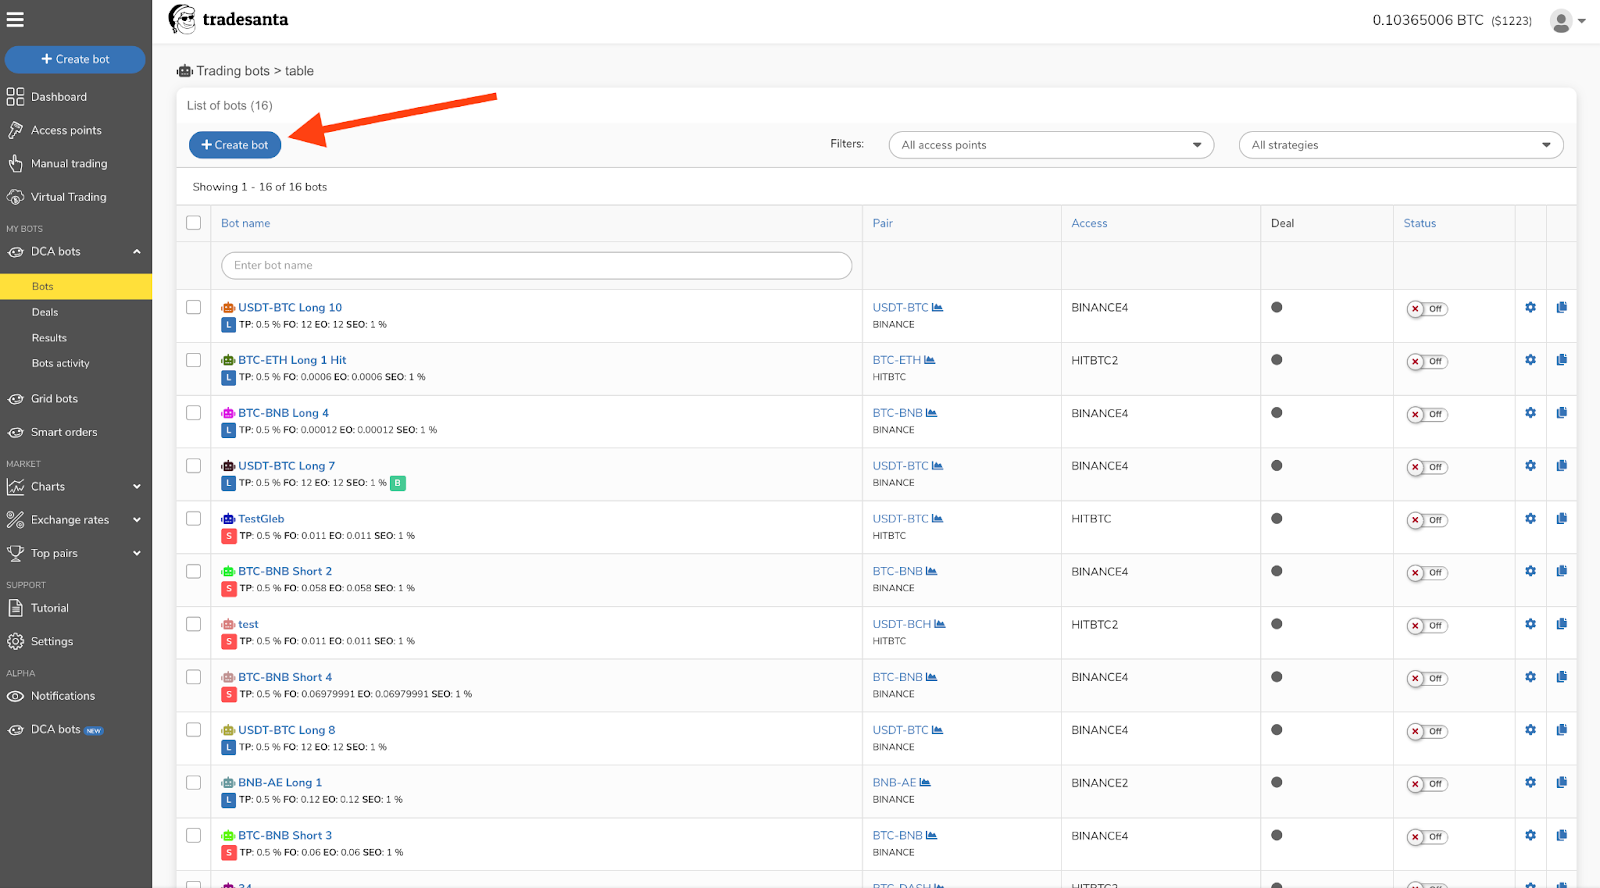
After all this is done, you can create a new bot by clicking the “+Create bot” button in the top left of the menu. You will be offered to choose strategy, pair, and bot settings.
Alternatively, you can create a new bot by clicking the “My bots” section in your left menu and click on the trading strategy you want to trade with (DCA, Smart Order, or Grid). Once you’re inside the bot’s list, click on the “+Create bot” button.
Now, you can choose your trading strategy, a preferable trading pair, and choose a position: long or short.
When you’re done with the initial settings, TradeSanta will link you to the next page, where you can choose more detailed settings and options.
And that pretty much covers it. You only need to set it up once to learn all the ropes, so you won’t have any issues setting up bots in the future!
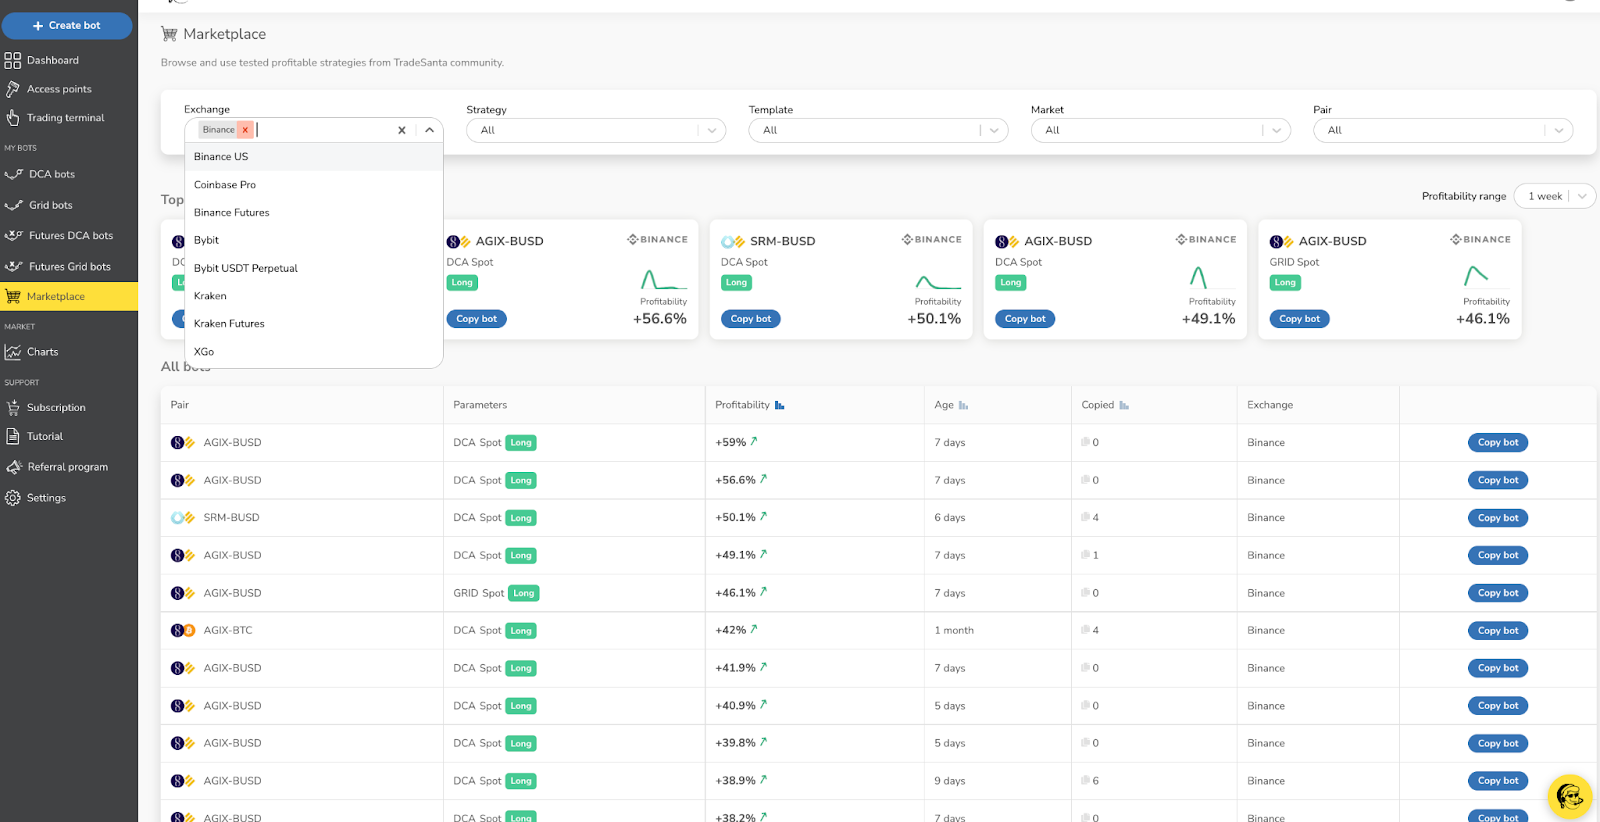
But that’s not all. In case you don’t want to settle the bot yourself or are not sure which strategy to uphold, you can always check TradeSanta’s Marketplace, where you can pick the bots that have tested profitable strategies from the TradeSanta community. There, you can filter bots by exchanges and copy strategies and settings from experienced traders.
To find out more about TradeSanta, check out the useful links below:
Author: Renat Rashevskiy
Renat is a cryptocurrency writer and enthusiast. He is in love with blockchain technology and willing to help people learn more about it.