Crypto trading has been around for some time, and while we can’t say anymore that it is a new concept, we can (and we do) still admit that trading crypto can require extensive knowledge, much patience, and the littlest of experience in the industry.
Of course, you can simply start trading crypto, but you might feel a bit overwhelmed by all the new terms, the types of trading, and how specialized crypto trading platforms look and work.
However, you should not worry because if you take things one step at a time, crypto trading can be remarkably enjoyable, engaging, and not that hard to understand.
While you can choose to follow several types of crypto trading, swing trading is always recommended to users who already know what crypto is about but do not want to dive too deep into crypto trading from their 1st experience.
But choosing a trading type you want to follow is not enough. Each trading strategy implies following technical indicators that tell you when to enter and exit positions to get significant profits out of this activity or at least not lose part of your funds.
So, this article will explain what swing trading is and the best swing trading indicators you should follow to make the best out of your budget and overall trading activity.
What Is Swing Trading?

Swing trading is one of the most popular types of trading, being used by a significant percentage of traders. Swing traders can trade various types of assets, such as stocks, equities, bonds, mutual funds, derivatives, ETFs (Exchange-Traded Funds), or crypto.
Usually, swing trading implies holding a position for a longer period. However, this period usually does not exceed a couple of months, but there are some cases in which traders might hold crypto for a little longer and still consider their strategy swing trading due to other factors.
Swing traders aim to notice and profit from cryptocurrencies’ inevitable price movement and volatility. This strategy is named swing trading because you simply take advantage of the price or market “swings.”
Swing trading usually implies following technical analysis tools such as support and resistance levels, leading and lagging indicators, and trading indicators and trying to take advantage of them.
While swing trading may not be as profitable as other types of trading, especially in the first place, it is still a great way to make a constant profit, and it can be suitable for those just starting their crypto trading journey.
In general, a swing trader might focus on short-term analysis. When you look at a cryptocurrency’s evolution, instead of studying it during the past years, you focus on the past days or a few weeks.
Many crypto traders might consider swing trading the “middle ground” between day trading and HODL (Hold on for Dear Life).
While in day trading, you have to check the market evolution often, and in HODLing, you hold a cryptocurrency for a long time, swing trading does not require you to stay glued to your computer nor hold crypto for as long as you forget about it.
Other Types of Trading

Scalping
Scalping involves profiting from extremely short-term price movements. Those following a scalping strategy aim to hold trading positions for just a few minutes, even a few seconds in some cases, and profit from small price fluctuations.
However, with scalping, it is essential to consider the fees you are charged, as the profit you make is not as remarkable as some may think. Thus, you should find a way to use scalping without putting all your profits into trading fees.
Besides, scalping might be suitable for more experienced traders, as it requires quick decision-making and discipline. If you don’t analyze all the factors, you might enter and exit positions at the wrong time and, in the worst-case scenario, lose the funds you attributed to this trading strategy.
Day Trading
As mentioned earlier, day trading is a short-term trading strategy where traders enter and exit positions on the same day. Although it is a pretty popular trading strategy, day trading requires constant attention and might be a little too dynamic for beginner traders.
However, it should be noted that, with day trading, you might make a little more profit than with swing trading. Furthermore, you don’t risk lowering your profits overnight as you exit positions during the day.
Still, with high rewards come high risks, which also applies to day trading. Thus, if you are not 100% willing to risk your budget in day trading, you might want to consider other trading strategies.
Position Trading
Position trading implies holding assets for longer periods, ranging from a few months to a few years. Occasionally, position traders might even hold a position for a decade. The main goal of position trading is to profit from major market trends instead of focusing on short-term price movements.
A position trading strategy might require less effort as you do not check the market evolution every hour or day. Furthermore, position traders can come with higher profits than other trading strategies.
However, if you choose position trading only, you cannot profit from short-term market opportunities, which might affect your overall profits. Besides, holding positions for a longer time can limit your liquidity and require a detailed and well-developed risk management plan.
Types of Trading Indicators
There are numerous trading indicators, and each can help traders notice various market movements that can contribute to deciding whether it’s time to enter or exit a position. However, some of the most popular types of trading indicators include:
- Trend indicators: They indicate whether a trend is forming. They show the direction the market is taking and smooth price volatility to have a better view of the primary trend. Two of the most popular trend indicators include Simple Moving Averages (SMA) and Moving Average Convergence Divergence (MACD);
- Volume indicators: strongly related to the trading volume, they indicate how many traders buy or sell an asset at a given time. A good example of a volume indicator is the Volume Oscillator;
- Momentum indicators show how strong a trend is and can also indicate potential trend reversals. A momentum indicator can also show overbought and oversold levels. Momentum indicators worth following include the Relative Strength Index (RSI) and the Stochastic Oscillator;
- Volatility indicators indicate periods of high or low volatility and can contribute to determining potential associated risks. The most popular volatility indicator is the Bollinger Bands.
Swing Trading Indicators to Follow
While following many trading indicators would seem like a good idea, quantity does not always lead to quality. Thus, we’ve selected some of the best technical indicators for swing trading.
Moving Averages
Usually, moving averages calculate the market’s price movements for a specific period by averaging closing prices. Moving averages are considered lagging indicators as they study past price evolution. As lagging indicators, moving averages confirm trends rather than predict them.
Moving averages can be divided into 3 main categories: short-term, medium-term, or long-term MAs. In general, 5-period to 50-period MAs are considered short-term. Medium-term MAs are usually between 50-period and 100-period, while 100-200-period MAs are long-term.
Swing traders use moving averages to find crossovers. A crossover happens when a short-term MA crosses a longer-term MA. A crossover can indicate there might be a change in momentum.
There are 2 main types of crossovers: golden crossover and death cross. The golden crossover occurs when a positive short-term moving average crosses another positive long-term MA. On the other hand, a death cross occurs when a negative short-term MA crosses a positive long-term moving average.
While a golden crossover can indicate a potential bullish signal, a death cross usually predicts a potential bearish trend.
There are multiple types of moving averages, but the most popular are Simple Moving Average (SMA), Exponential Moving Average (EMA), and Moving Average Convergence Divergence (MACD).
Simple Moving Averages (SMA)
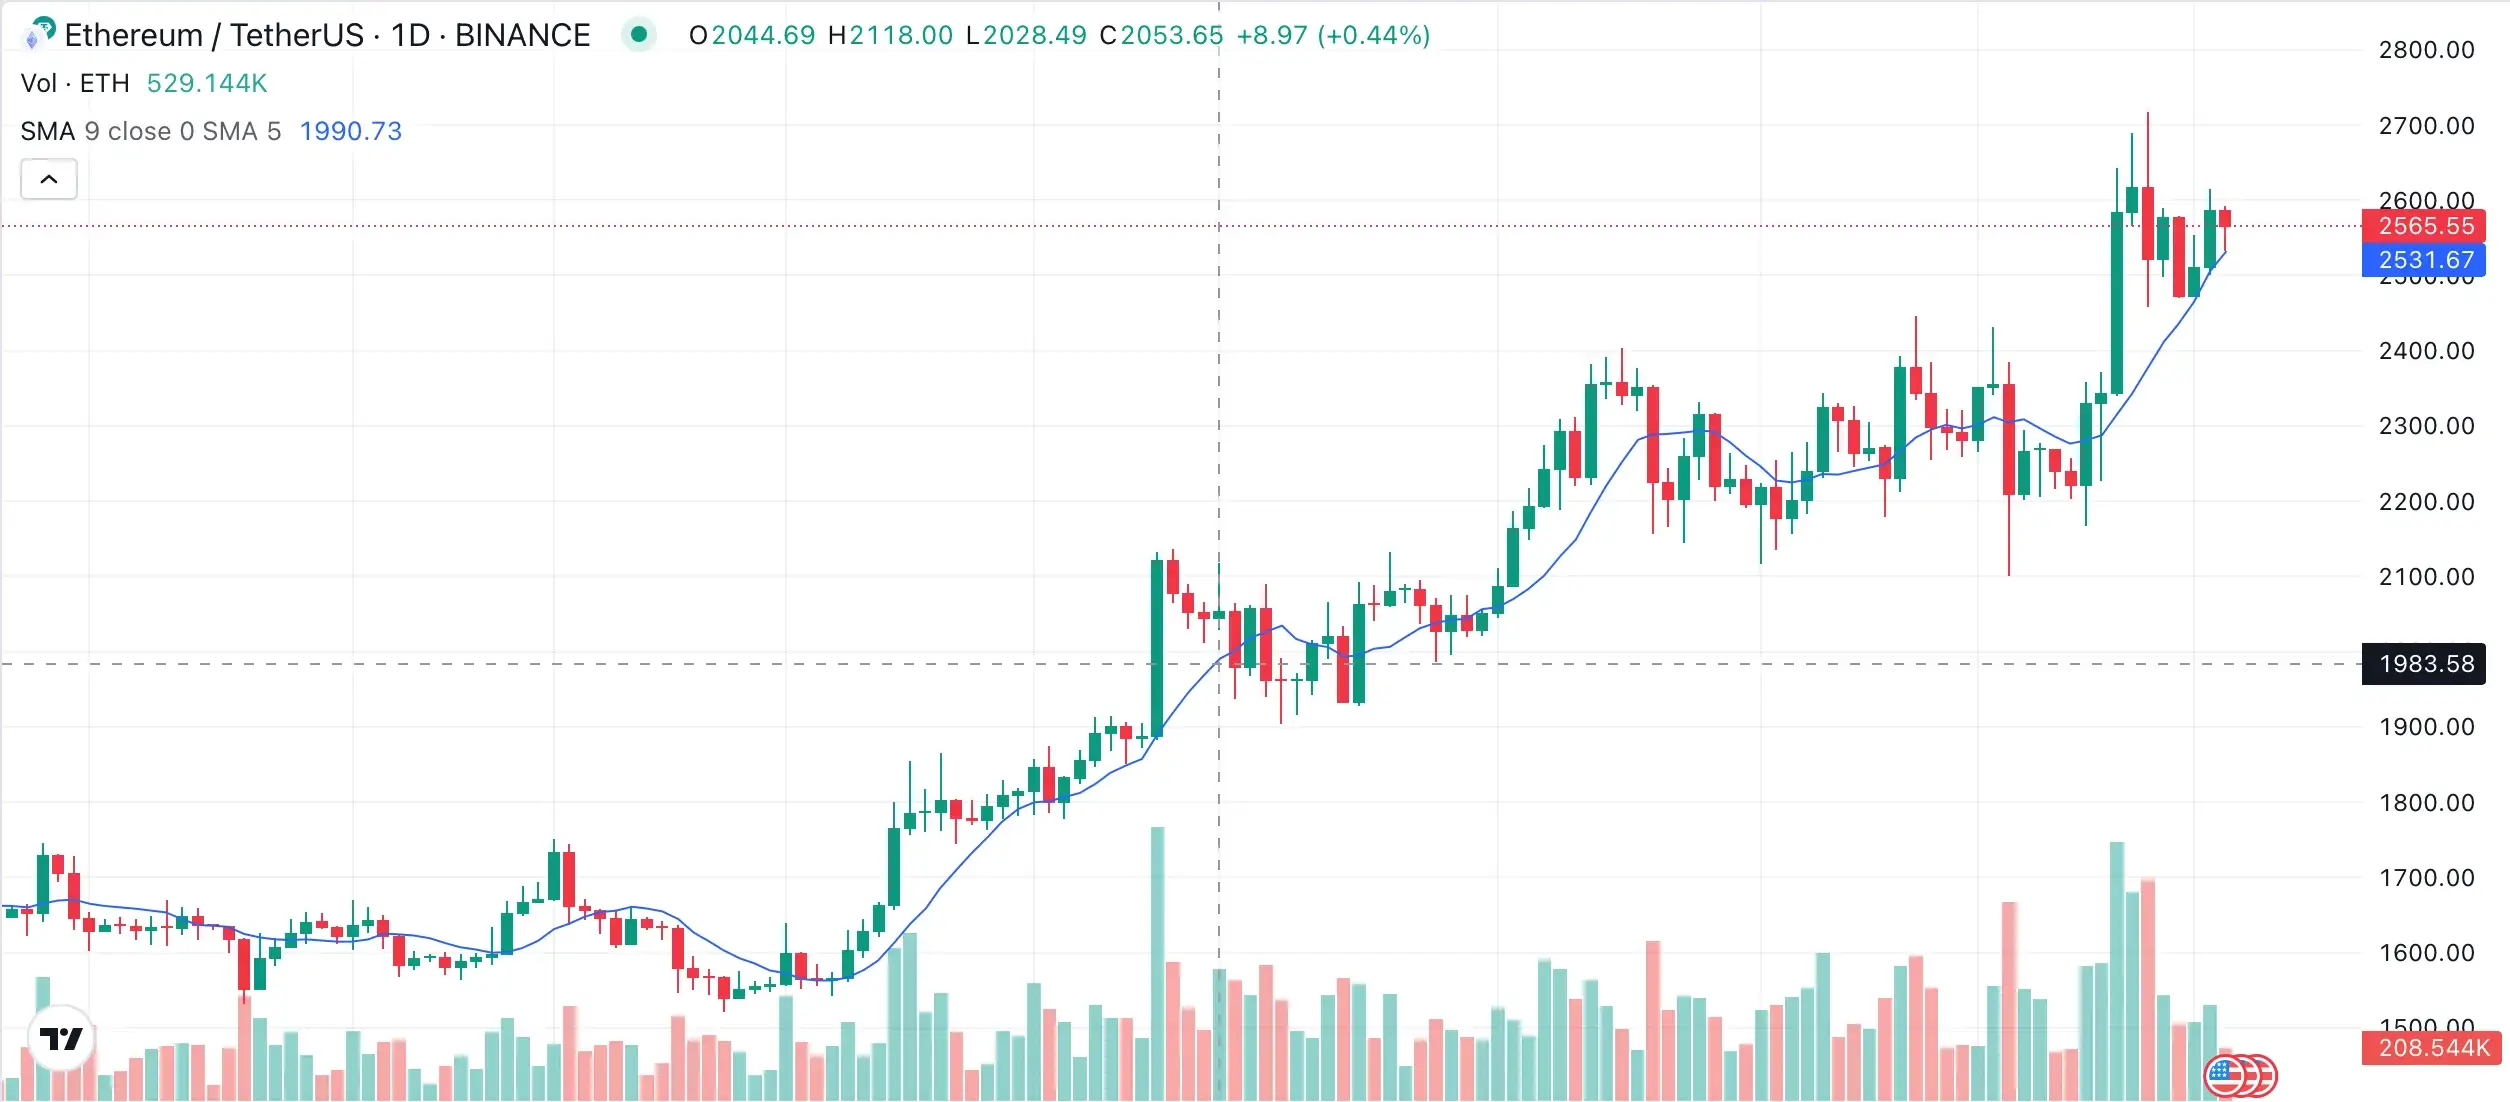
The simple moving average may be the most widely used MA of them all and is calculated by summing recent closing prices and dividing the total by the number of periods.
So many swing traders use SMA to decide when to enter and exit the market. Although it is a lagging indicator, the simple moving average can smooth the price evolution and show when it is the right time to make a trading decision.
The formula for SMA is pretty straightforward:
SMA= (A1 + A2 + A3 +…+ An) / n
Where:
- A is the average price in period n;
- n is the number of periods.
Exponential Moving Averages (EMA)
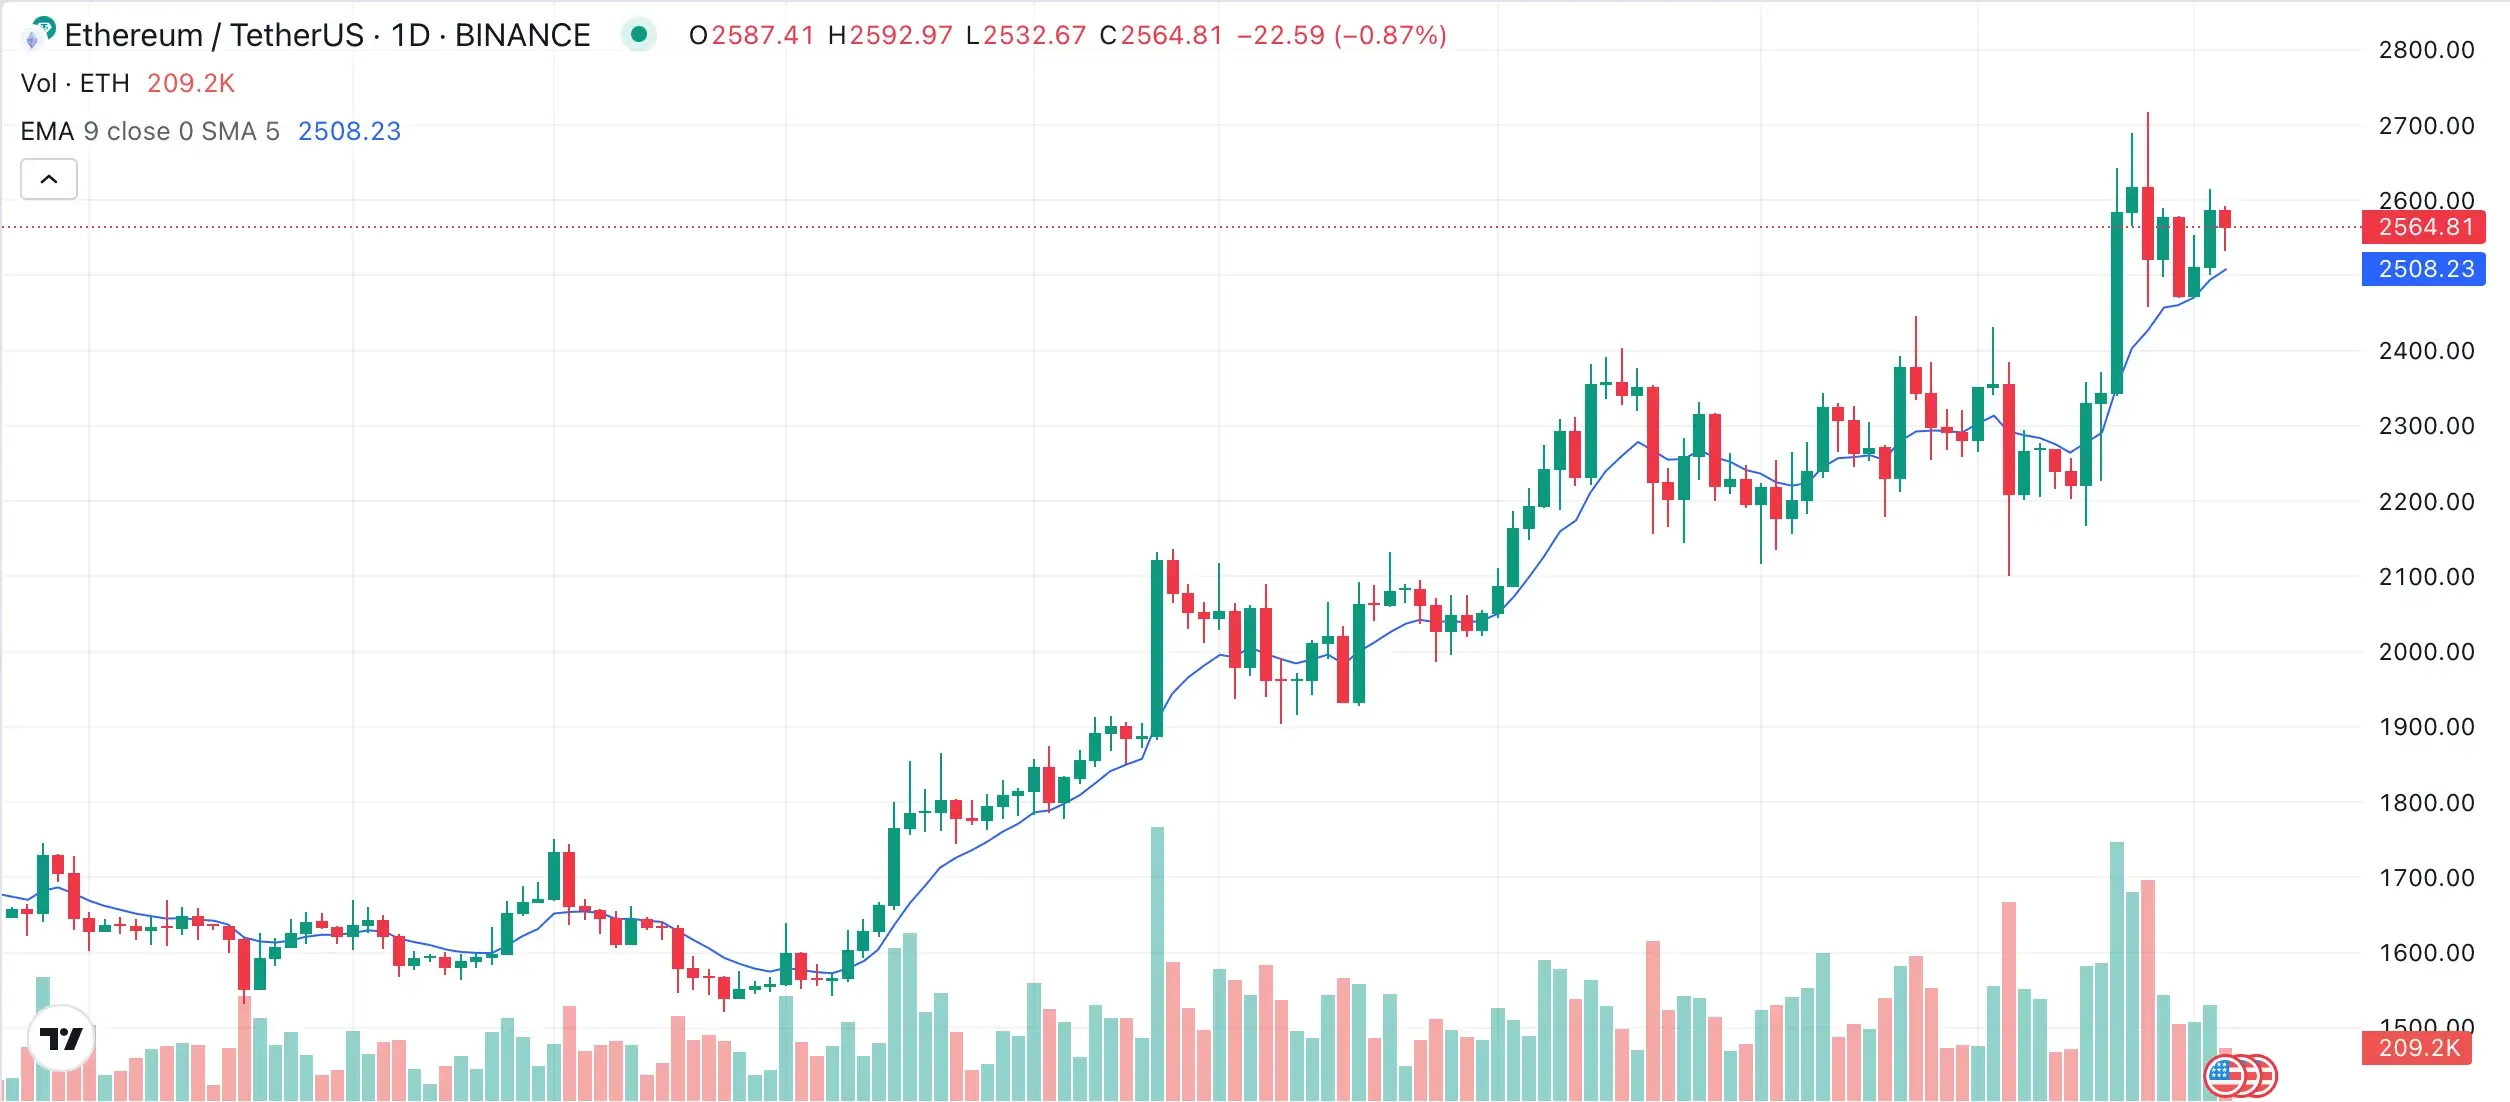
Another type of moving average is the exponential moving average (EMA). EMA is a little similar to SMA, but it gives more weight to the recent prices than SMA, which smooths them out. The goal of exponential moving averages is to make the indicator more responsive to recent price changes.
To calculate the exponential moving average, you have to follow multiple steps:
First, calculate the simple moving average (SMA) as we showed earlier;
Then, calculate the multiplier to weight the exponential moving average. To calculate the multiplier, use the formula Multiplier = [ 2 / (Selected time period +1)];
Lastly, calculate the current exponential moving average by taking the period from the initial EMA, using the price, multiplier, and the previous period’s EMA value (the SMA calculated earlier). Thus, you will get the formula:
Current EMA = [Closing Price – EMA (Previous Time Period)] * Multiplier + EMA (Previous time period).
Moving Average Convergence Divergence (MACD)
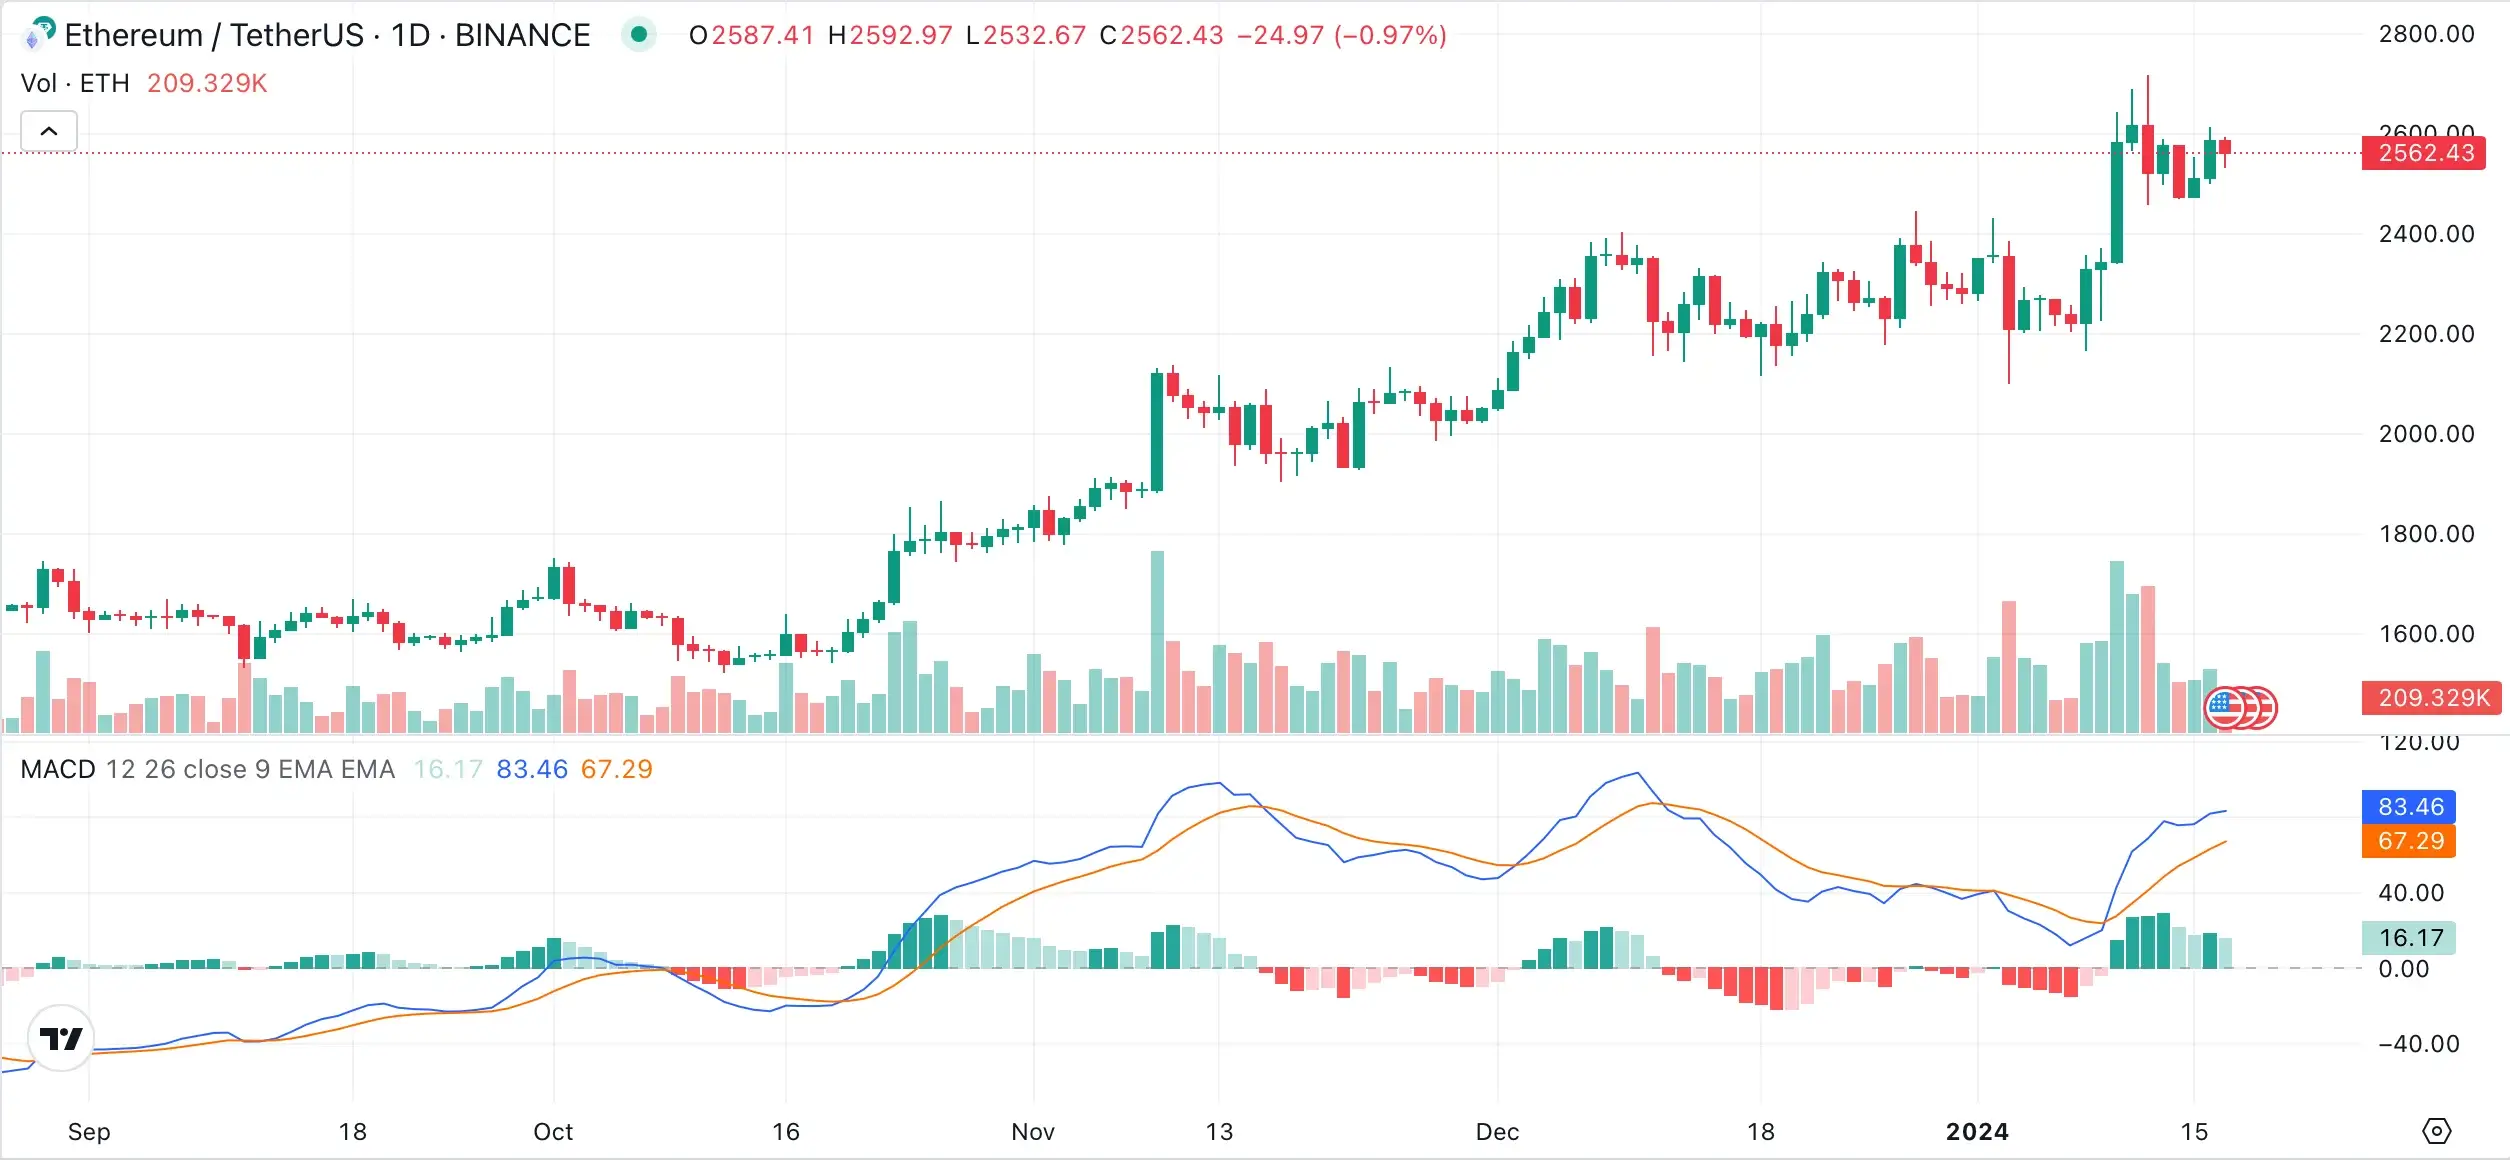
The moving average convergence divergence (MACD) is a trend indicator that shows the relation of 2 EMAs (Exponential Moving Averages). The MACD is generally calculated by subtracting a 26-period EMA from a 12-period EMA.
Although MACD is an oscillator, it is rarely used to identify overbought and oversold levels. However, the indicator can be used to trade trends.
MACD consists of 2 lines that oscillate without boundaries. When the lines cross, there may occur trading signals similar to a 2-MA system.
When the MACD crosses above 0, the trend is considered bullish, while crossing below 0 can be considered a bear move.
Moreover, when the MACD line crosses from below to above the signal line, the indicator can show bullish movement. The further below the line, the stronger the signal gets.
On the other hand, when the MACD line crosses from above to below the signal line, it can indicate a bearish trend. Reversely, the further above the zero line, the stronger the signal.
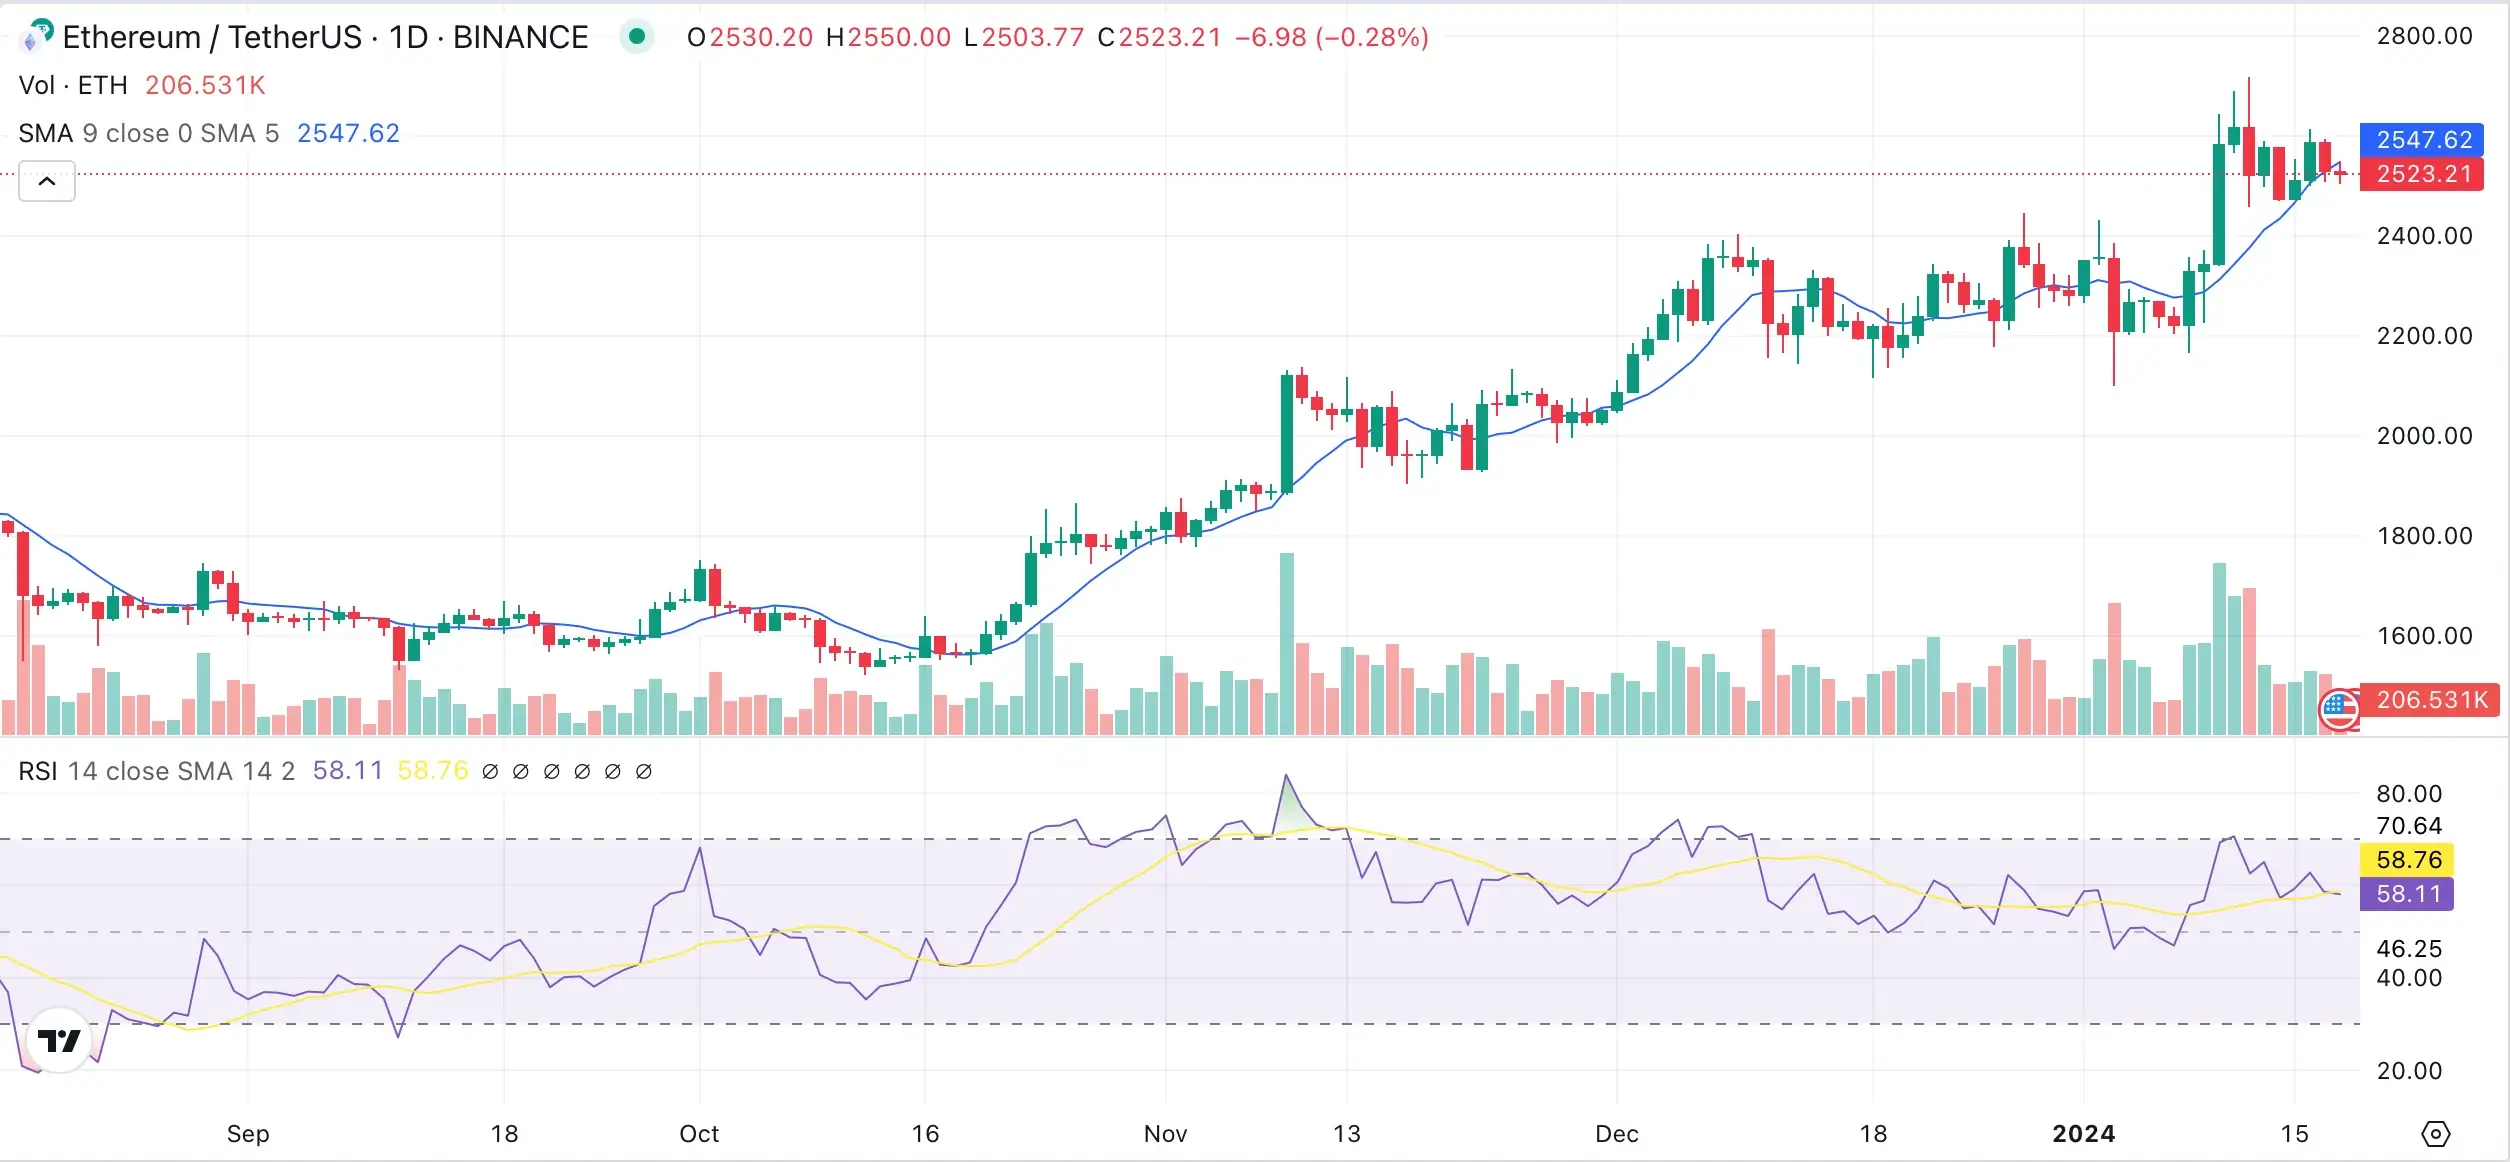
Relative Strength Index (RSI)
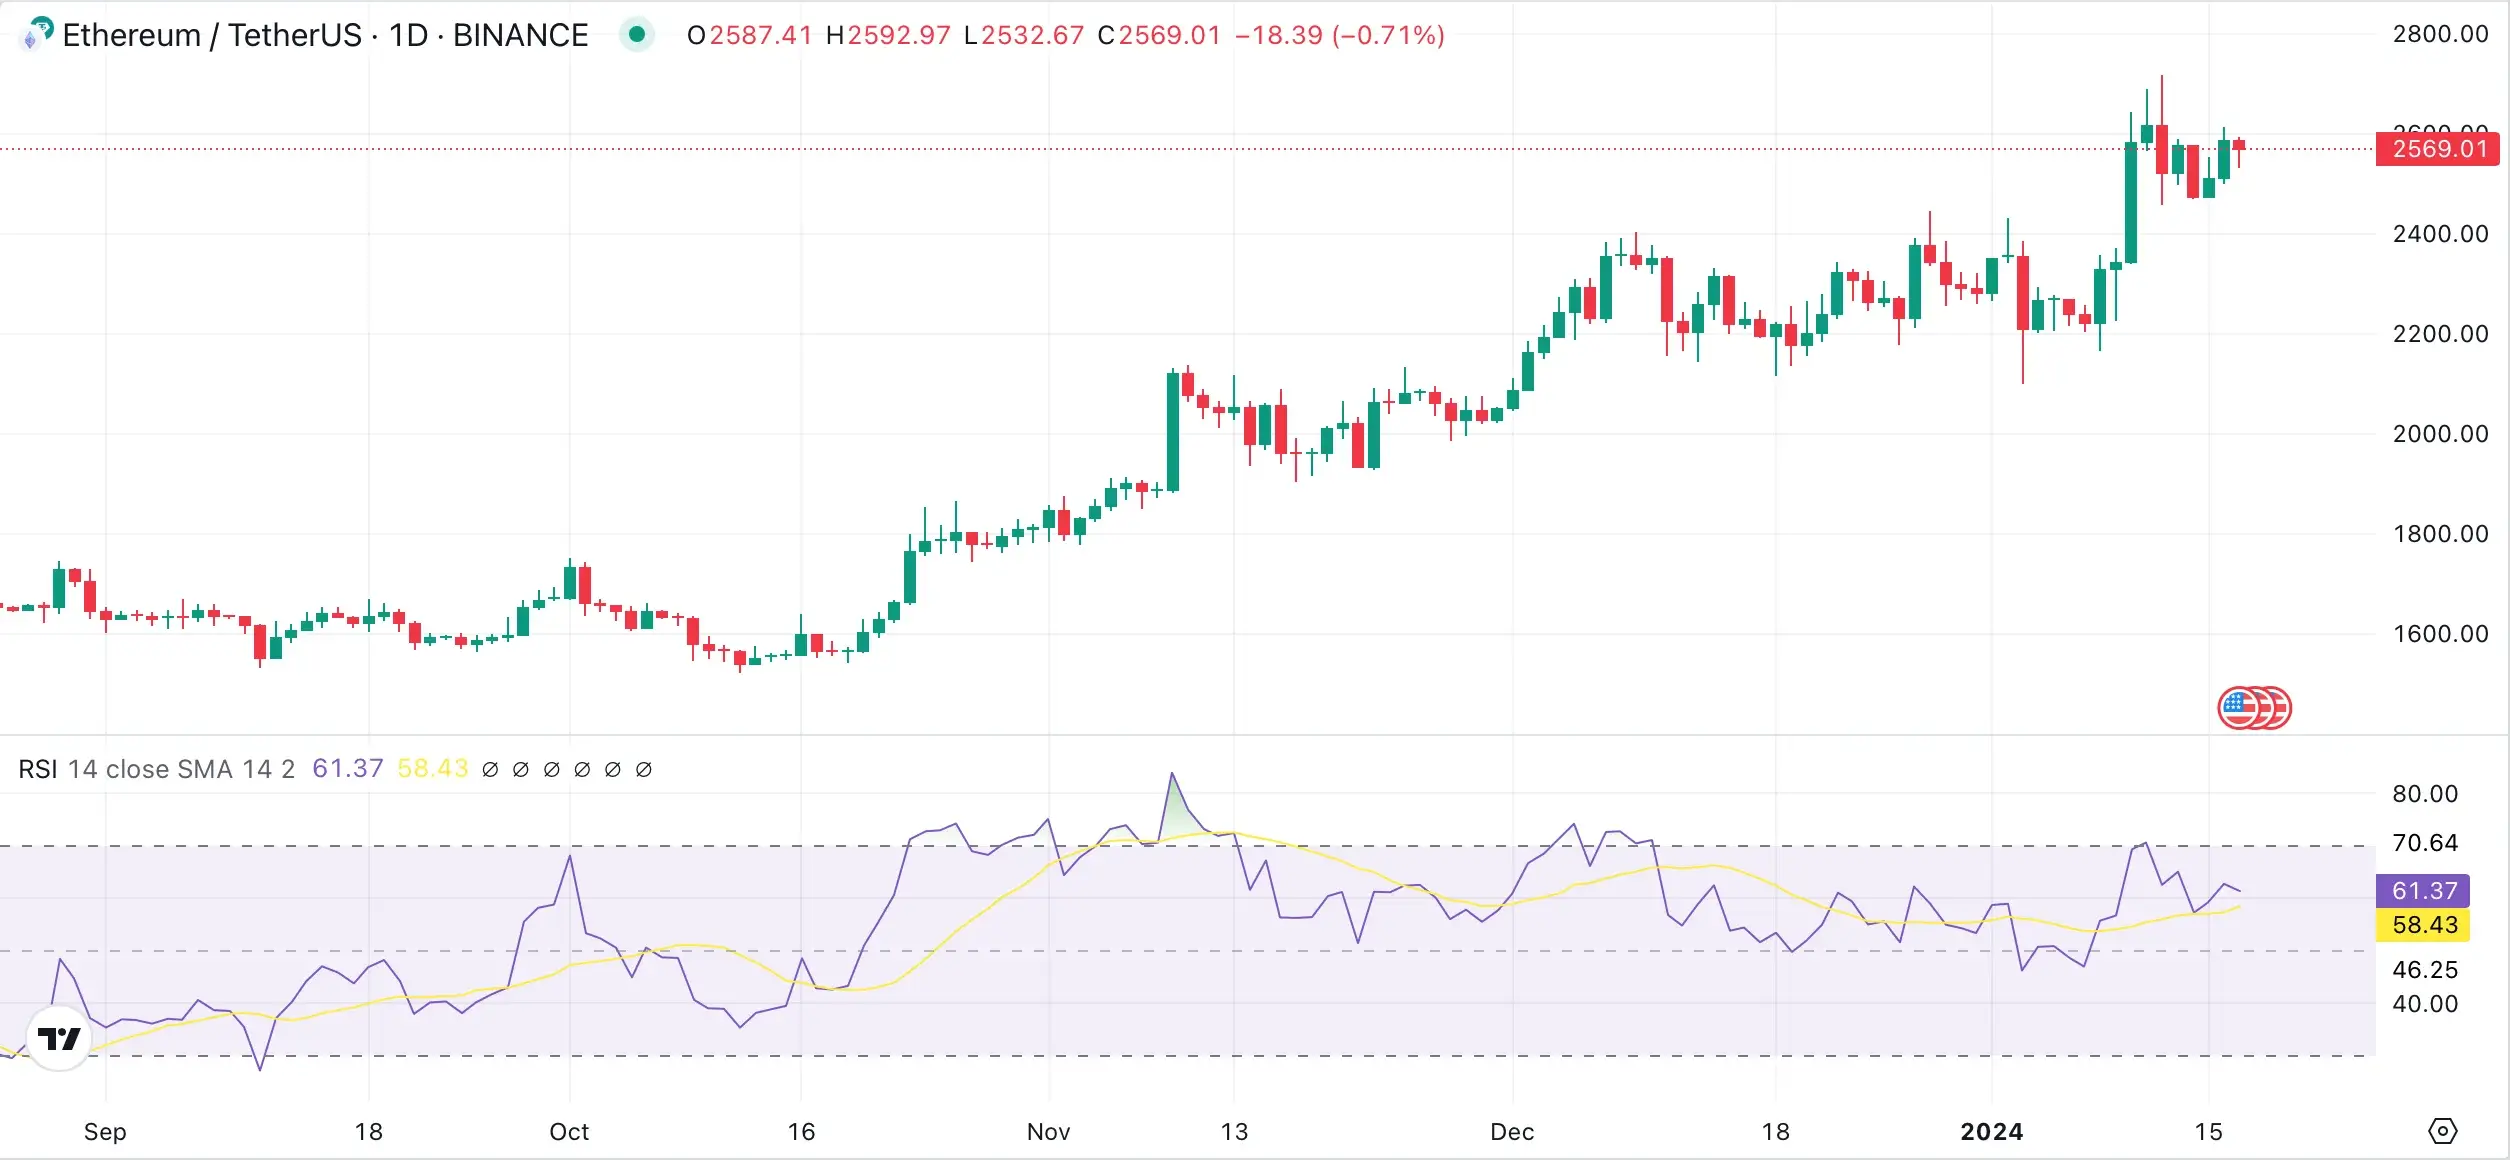
The Relative Strength Index (RSI) is a swing trading indicator that can highlight potential changes in a longer trend. RSI might be one of the most crucial trading indicators and can easily show whether a market is overbought or oversold, thus also signaling whether there is a swing coming.
The RSI usually measures the number and size of a market’s positive and negative closing prices over a set period. The indicator is an oscillator that moves between 0 and 100.
When following the relative strength indicator, you should look for some key values. For instance, what goes above 70 can generally indicate an overbought level, while what drops below 30 can be considered an oversold level.
While values higher than 70 can be a signal to open a short position, values lower than 30 can suggest traders to go long.
Volume Oscillator
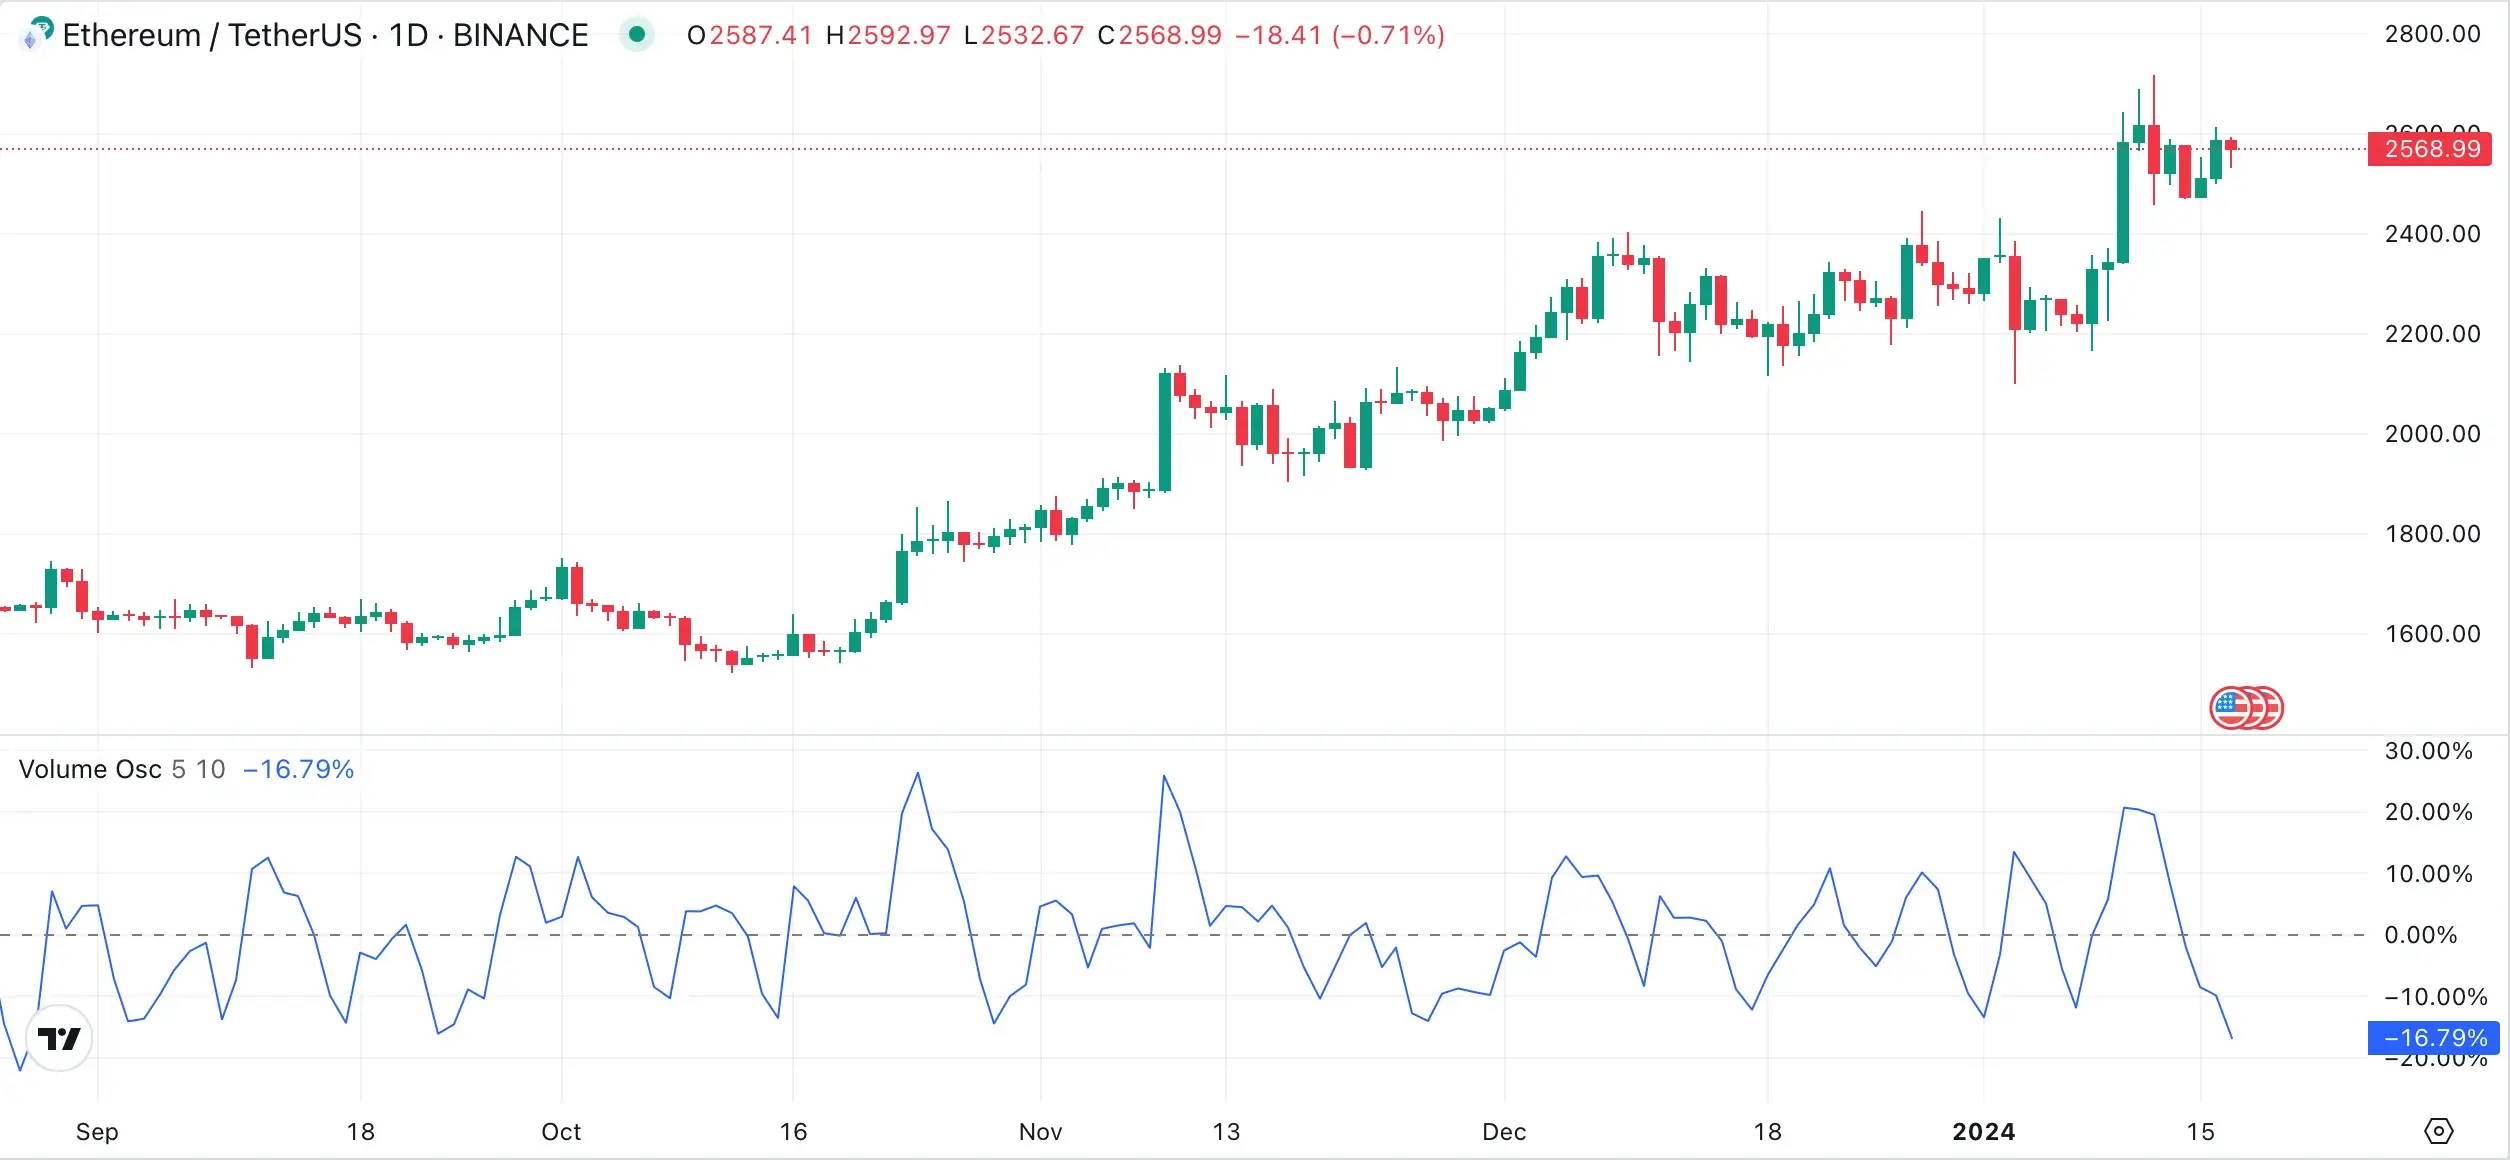
The volume indicator is a pretty popular trading indicator and provides valuable information regarding the strength of a new trend.
This indicator can be useful in breakout strategies. Breakouts usually follow a consolidation period combined with a low volume. After the breakout occurs, the volume increases.
Analyzing the volume indicator is pretty simple: a trend with a high volume is stronger than one with a lower volume. When more traders start to buy or sell an asset, the volume increases; thus, the trend gets stronger.
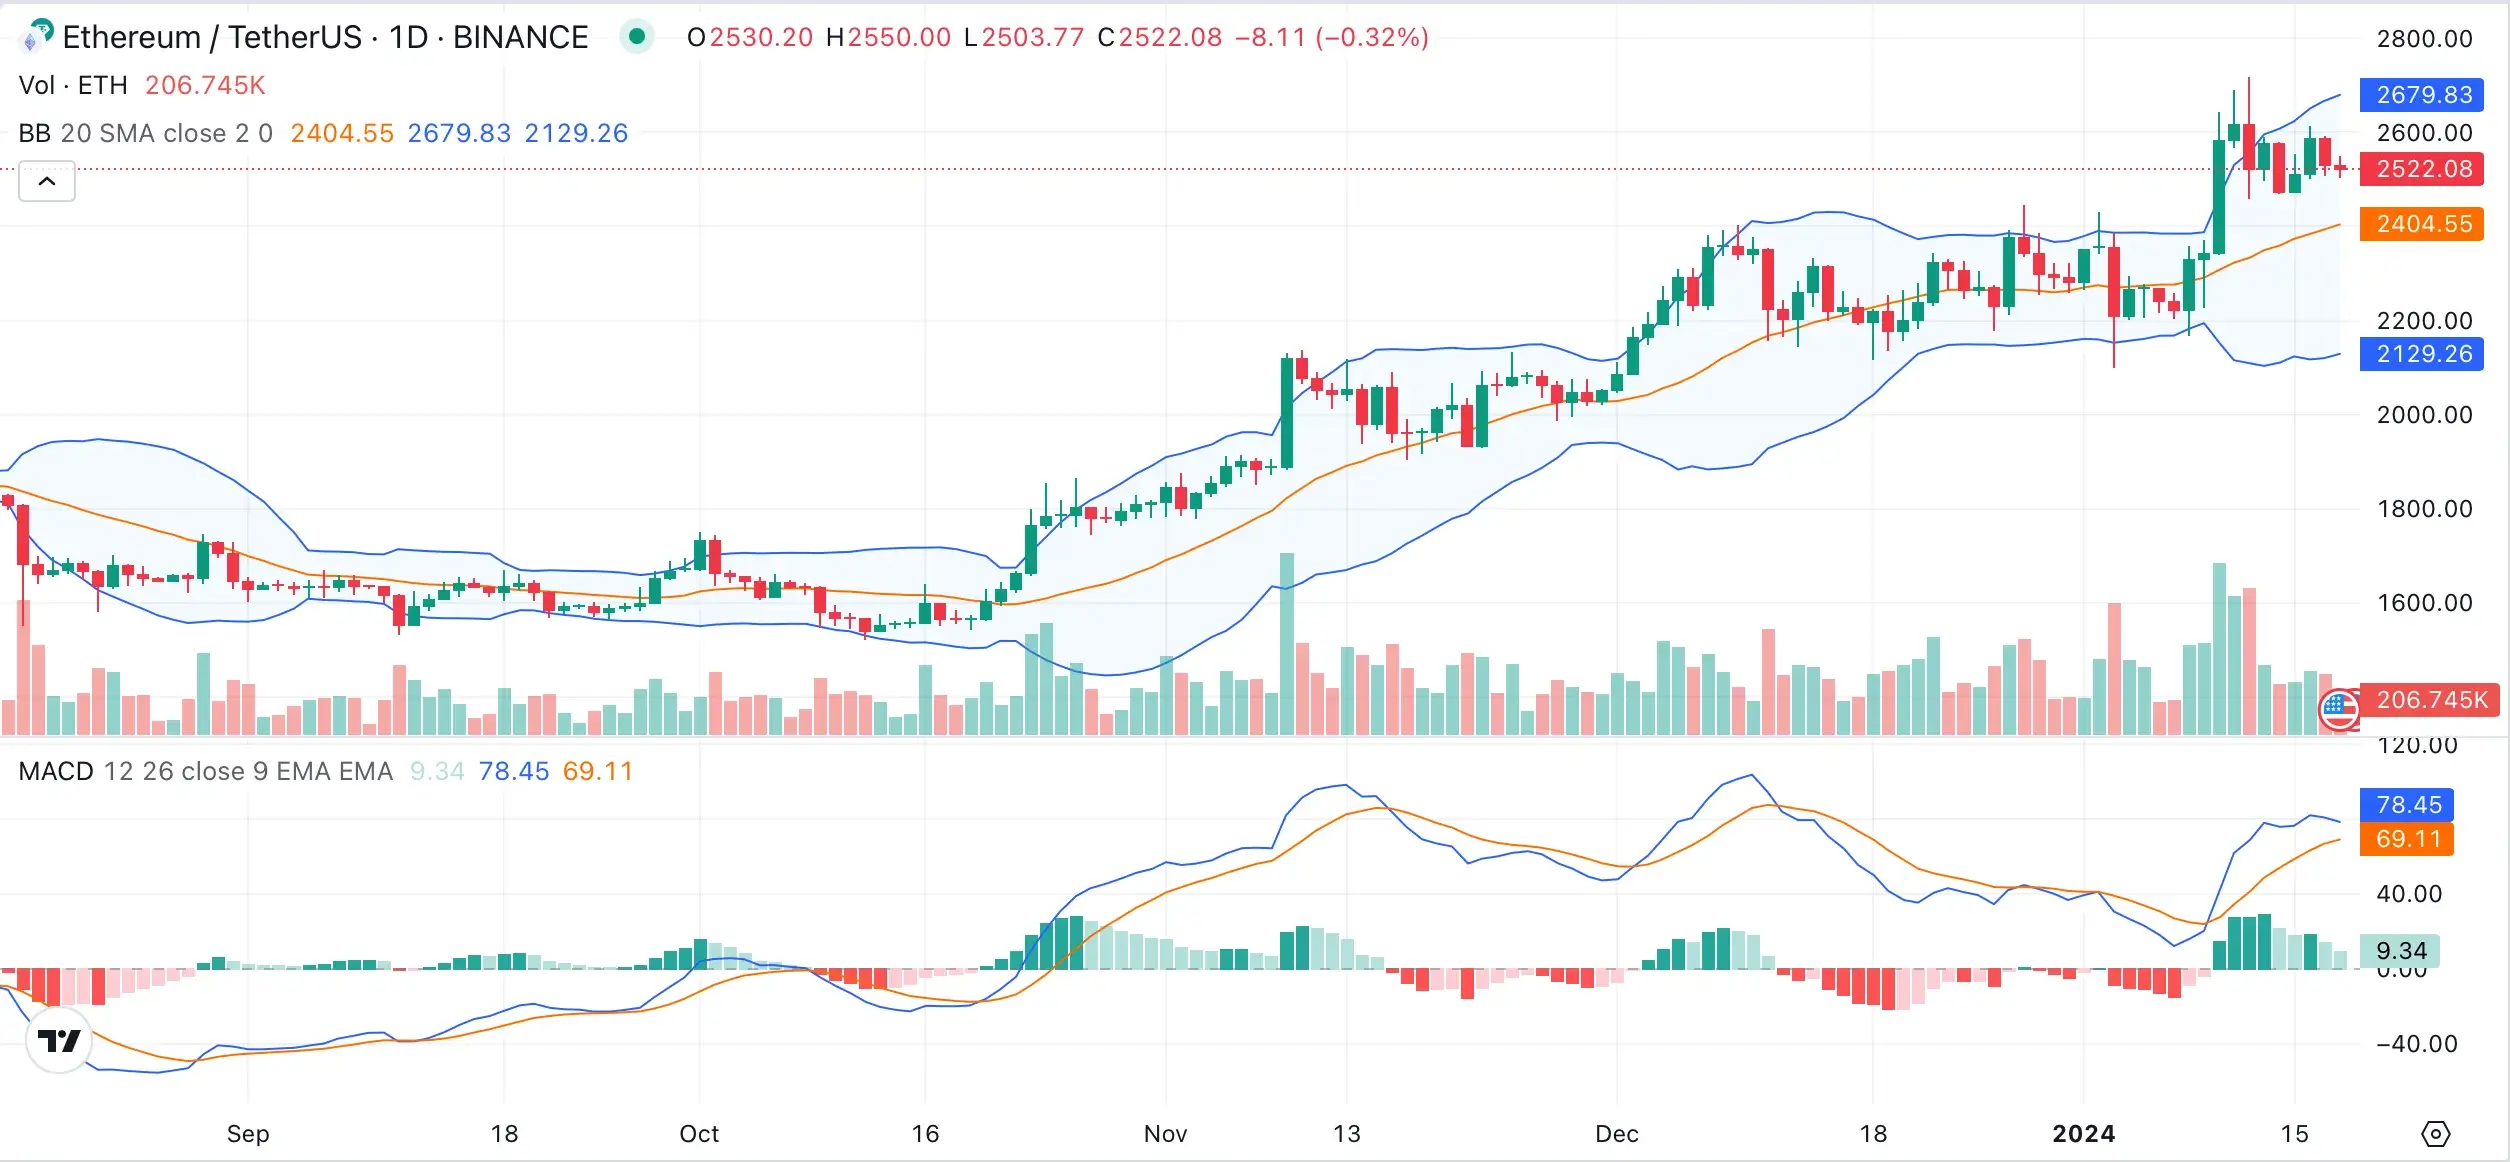
Bollinger Bands (BB)
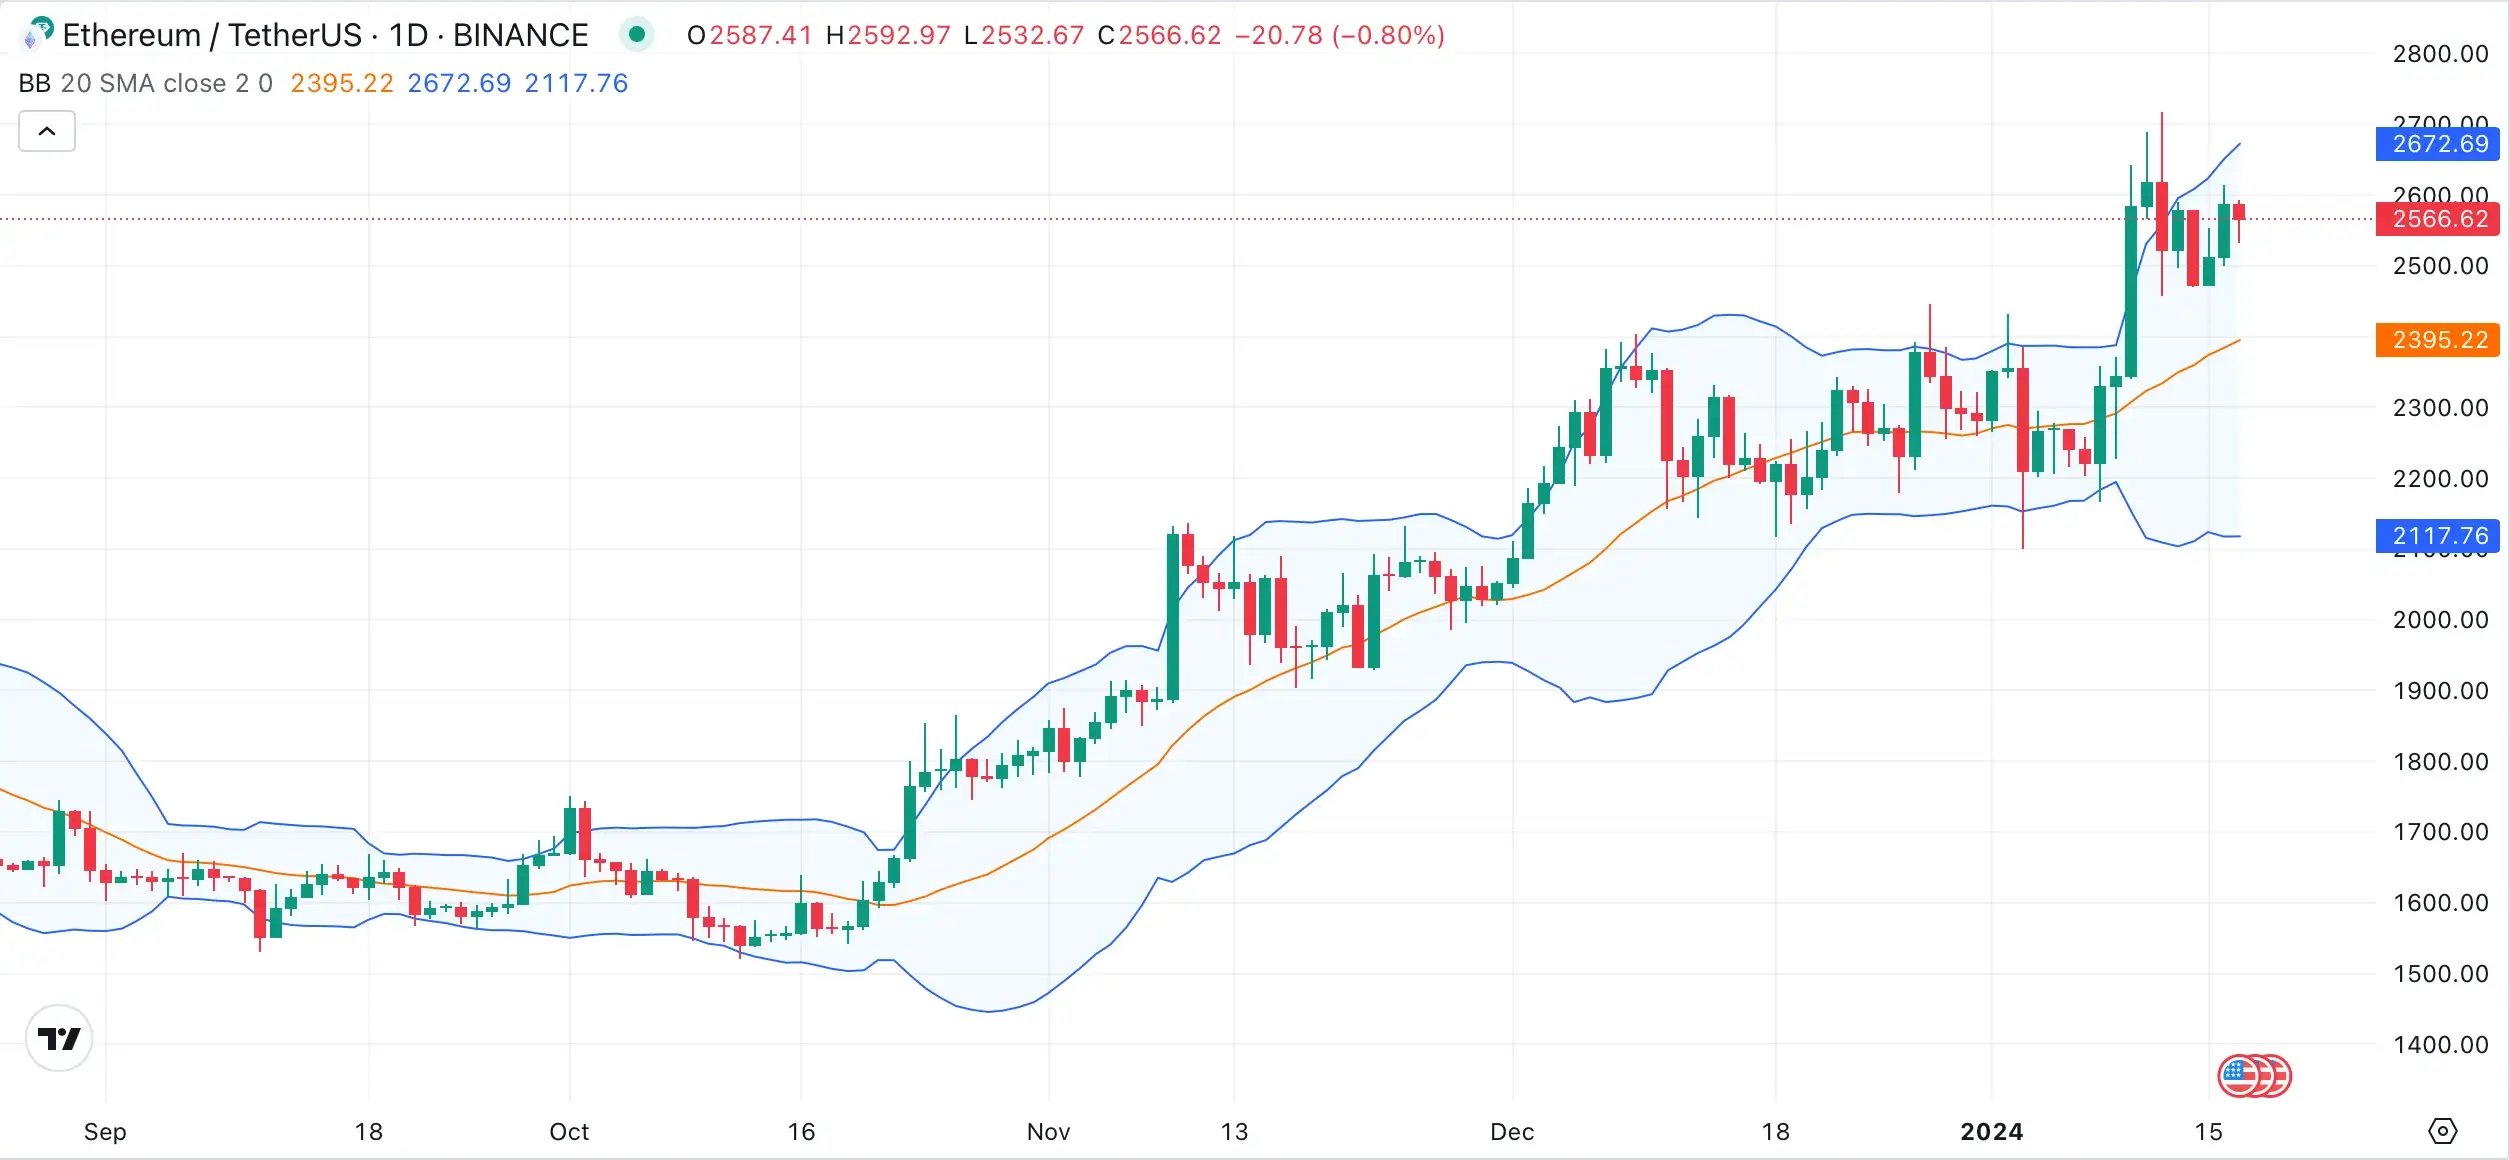
Bollinger Bands (BB) are an indicator that consists of 3 lines: a moving average and 2 standard deviations. Bollinger Bands can quickly determine a trend, indicate overbought and oversold levels, and determine the overall volatility of an asset.
The Bollinger bands’ width progresses according to the volatility evolution. Thus, if there is high volatility, BB width increases, while when the market experiences lower volatility, the width decreases.
When combined with MACD, BB can do wonders. The combination can confirm a trend’s direction and strength.
Furthermore, traders can use MACD and BB simultaneously to get additional confirmation for trading signals. Bollinger Bands are usually calculated for a 20-day period, but the period can sometimes vary.
As we mentioned earlier, BB is built with 3 lines. The upper band is set 2 standard deviations above the middle band. The middle band is the SMA (Simple Moving Average). The lower band is set 2 standard deviations below the middle band or moving average.
Stochastic Oscillator
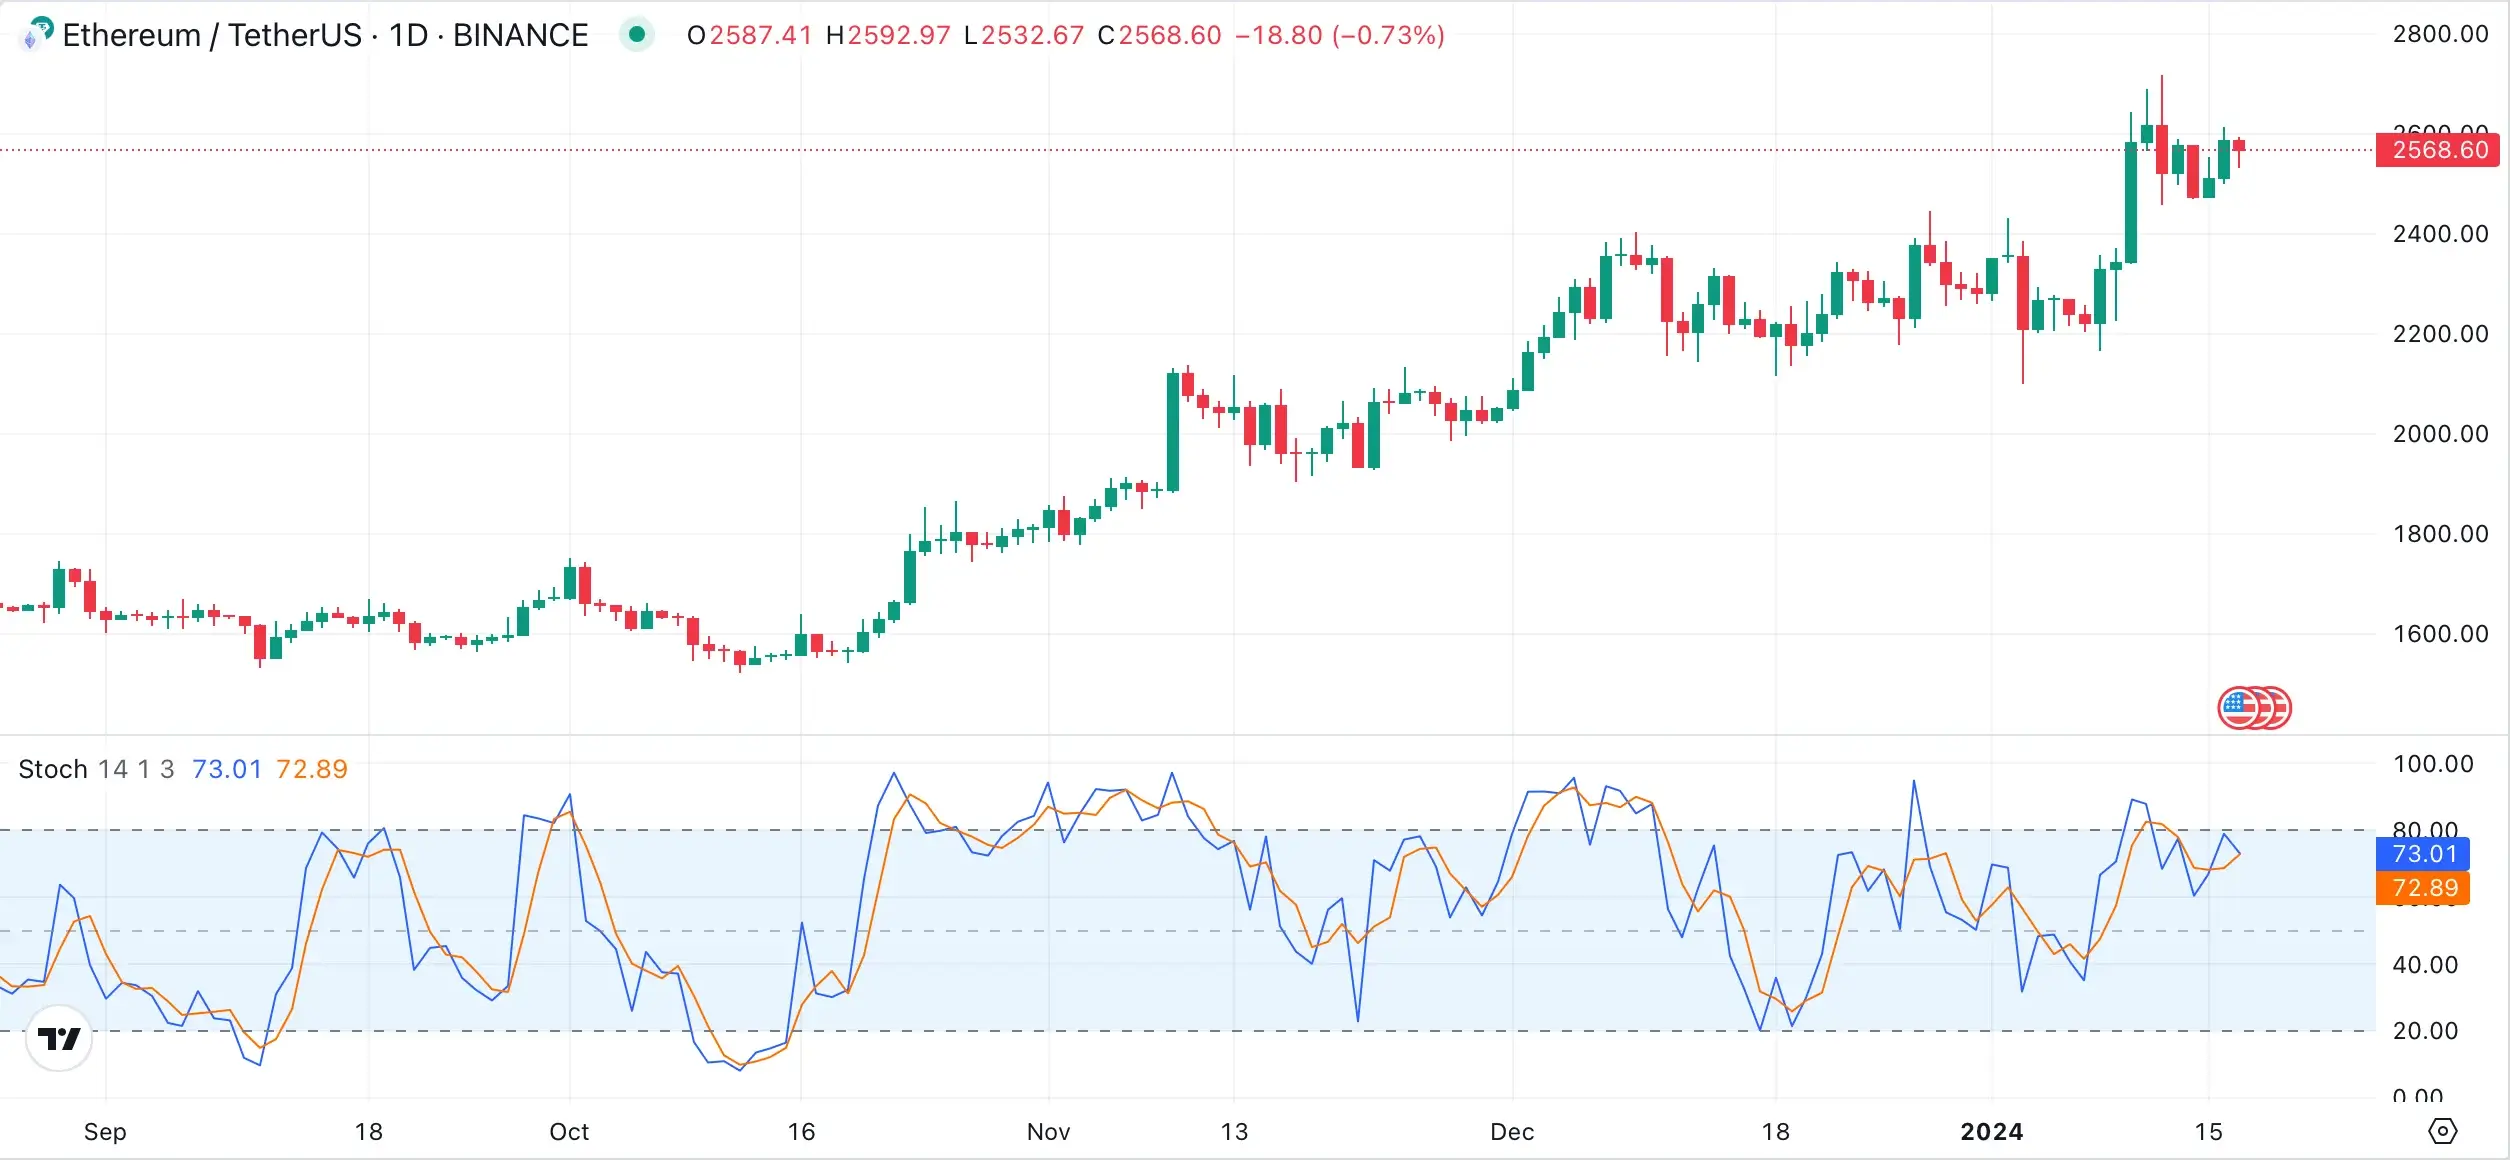
The stochastic oscillator is a momentum indicator that works similarly to the RSI. Usually, the stochastic oscillator compares the closing price of an asset to the range of its prices over a set period.
As you might have thought, the stochastic oscillator is shown on a chart that ranges between 0 and 100. However, the key values differ a little. While in RSI’s case, you would look for 30 and 70, with the stochastic oscillator, you have to look for 80 and 20.
In general, what goes above 80 is considered an overbought level, while what falls under 20 is an oversold level.
Unlike the RSI, the stochastic oscillator consists of 2 lines. One line shows the current value of the oscillator, while the other shows a 3-day moving average.
How to Combine Swing Trading Indicators? – Dos and Don’ts
It is highly recommended to combine swing trading indicators, as multiple such indicators can confirm a trend, breakout, or trend reversal. However, it is how you combine them that can help you.
For instance, you should not combine 2 indicators of the same type. For instance, there is no reason to combine SMA with EMA, as they will show you similar information.
Instead, combine swing trading indicators of different types, such as trend, momentum, and volatility indicators.
It might help you to combine the RSI with the SMA or EMA. While the former is a momentum indicator, the moving averages are trend indicators. Furthermore, the moving average is a lagging indicator, while the RSI is a leading indicator. Thus, SMA or EMA can confirm what RSI predicted or indicated.
Furthermore, try to combine Bollinger bands with MACD. MACD indicates trend direction, while BB can further confirm it by offering details regarding the trend’s strength.
FAQ
Which is the best indicator for swing trading?
It is hard to name only one indicator, and it strongly depends on your strategy and experience. However, some of the most popular and widely used include moving averages and the RSI.
What indicators do professional traders use?
Professional traders rely on numerous indicators and combine them to make the best out of the information they provide. Usually, traders might choose BB, RSI, and moving averages.
What indicators work well together?
In general, you can combine indicators of different types. For instance, combine a trend indicator with a momentum indicator or even try to look at a lagging and a leading indicator simultaneously.
Is MACD a good indicator for swing trading?
MACD is highly recommended in swing trading, and many swing traders prefer to follow it to confirm trends.
Should I use RSI or MACD?
Yes, you can use RSI or MACD. You can go even further and combine them, as MACD will tend to confirm what RSI indicated.
In Conclusion
Swing trading is a good strategy for those who know how crypto or any other type of asset works but do not want to get stuck with a computer for day trading.
To use a swing trading strategy, you should always follow various indicators that can show you how and when a trend might occur, how strong it is, and whether there is a breakout or trend reversal on the horizon.
If you aim to be a swing trader, you can try to follow swing trading indicators such as moving averages, moving average convergence divergence (MACD), Bollinger bands (BB), volume, or the stochastic oscillator.