The Crypto Market Performance Report for Q3 2024. Insights from CoinGecko’s Report
After some stability following Bitcoin’s halving in Q2, whether we like to admit it or not, there has been stability compared to recent years. Thus, Q3 2024 brought new challenges shaped by global politics and economic changes.
As a result, the crypto market continues to be a mix of ups and downs.
Although the market didn’t see big swings, it was far from quiet. The U.S. Federal Reserve’s decisions, China’s economic stimulus, and unexpected moves from Japan all kept things active for cryptocurrencies.
Our overview of CoinGecko’s Q3 2024 Crypto Industry Report breaks down these important events and examines how Bitcoin, Ethereum, DeFi, NFTs, and centralized and decentralized exchanges performed.
With the market changing so fast, understanding these trends is critical for anyone involved.
Thanks to CoinGecko’s report, we managed to take on the most essential changes within the industry and present them so that you can prepare your strategies for what’s heading.
Key Takeaways
- The crypto market dropped by 1% in Q3 2024, closing at $2.33 trillion amid global economic uncertainty and interest rate fluctuations.
- Bitcoin’s market share increased to 53.6% by the end of Q3, reaching its highest dominance since April 2021, despite only a 0.8% gain in its price.
- Stablecoins grew by $11 billion in Q3, with Tether leading the market, holding a 70% share of the $170.2 billion stablecoin market.
- Prediction markets exploded, growing 565.4%, with Polymarket dominating as bets on the U.S. elections fueled trading volumes.
- The NFT market saw a sharp 61.3% decline in Q3, with Ethereum and Bitcoin NFT volumes suffering the most, while Layer 2 networks saw modest activity.
- Spot trading volume across the top 10 centralized exchanges dropped by 14.8%, with Binance’s share falling below 40%, while Crypto.com made significant gains.
1. Crypto Market Dips 1% in Q3 2024 Amid Economic Uncertainty
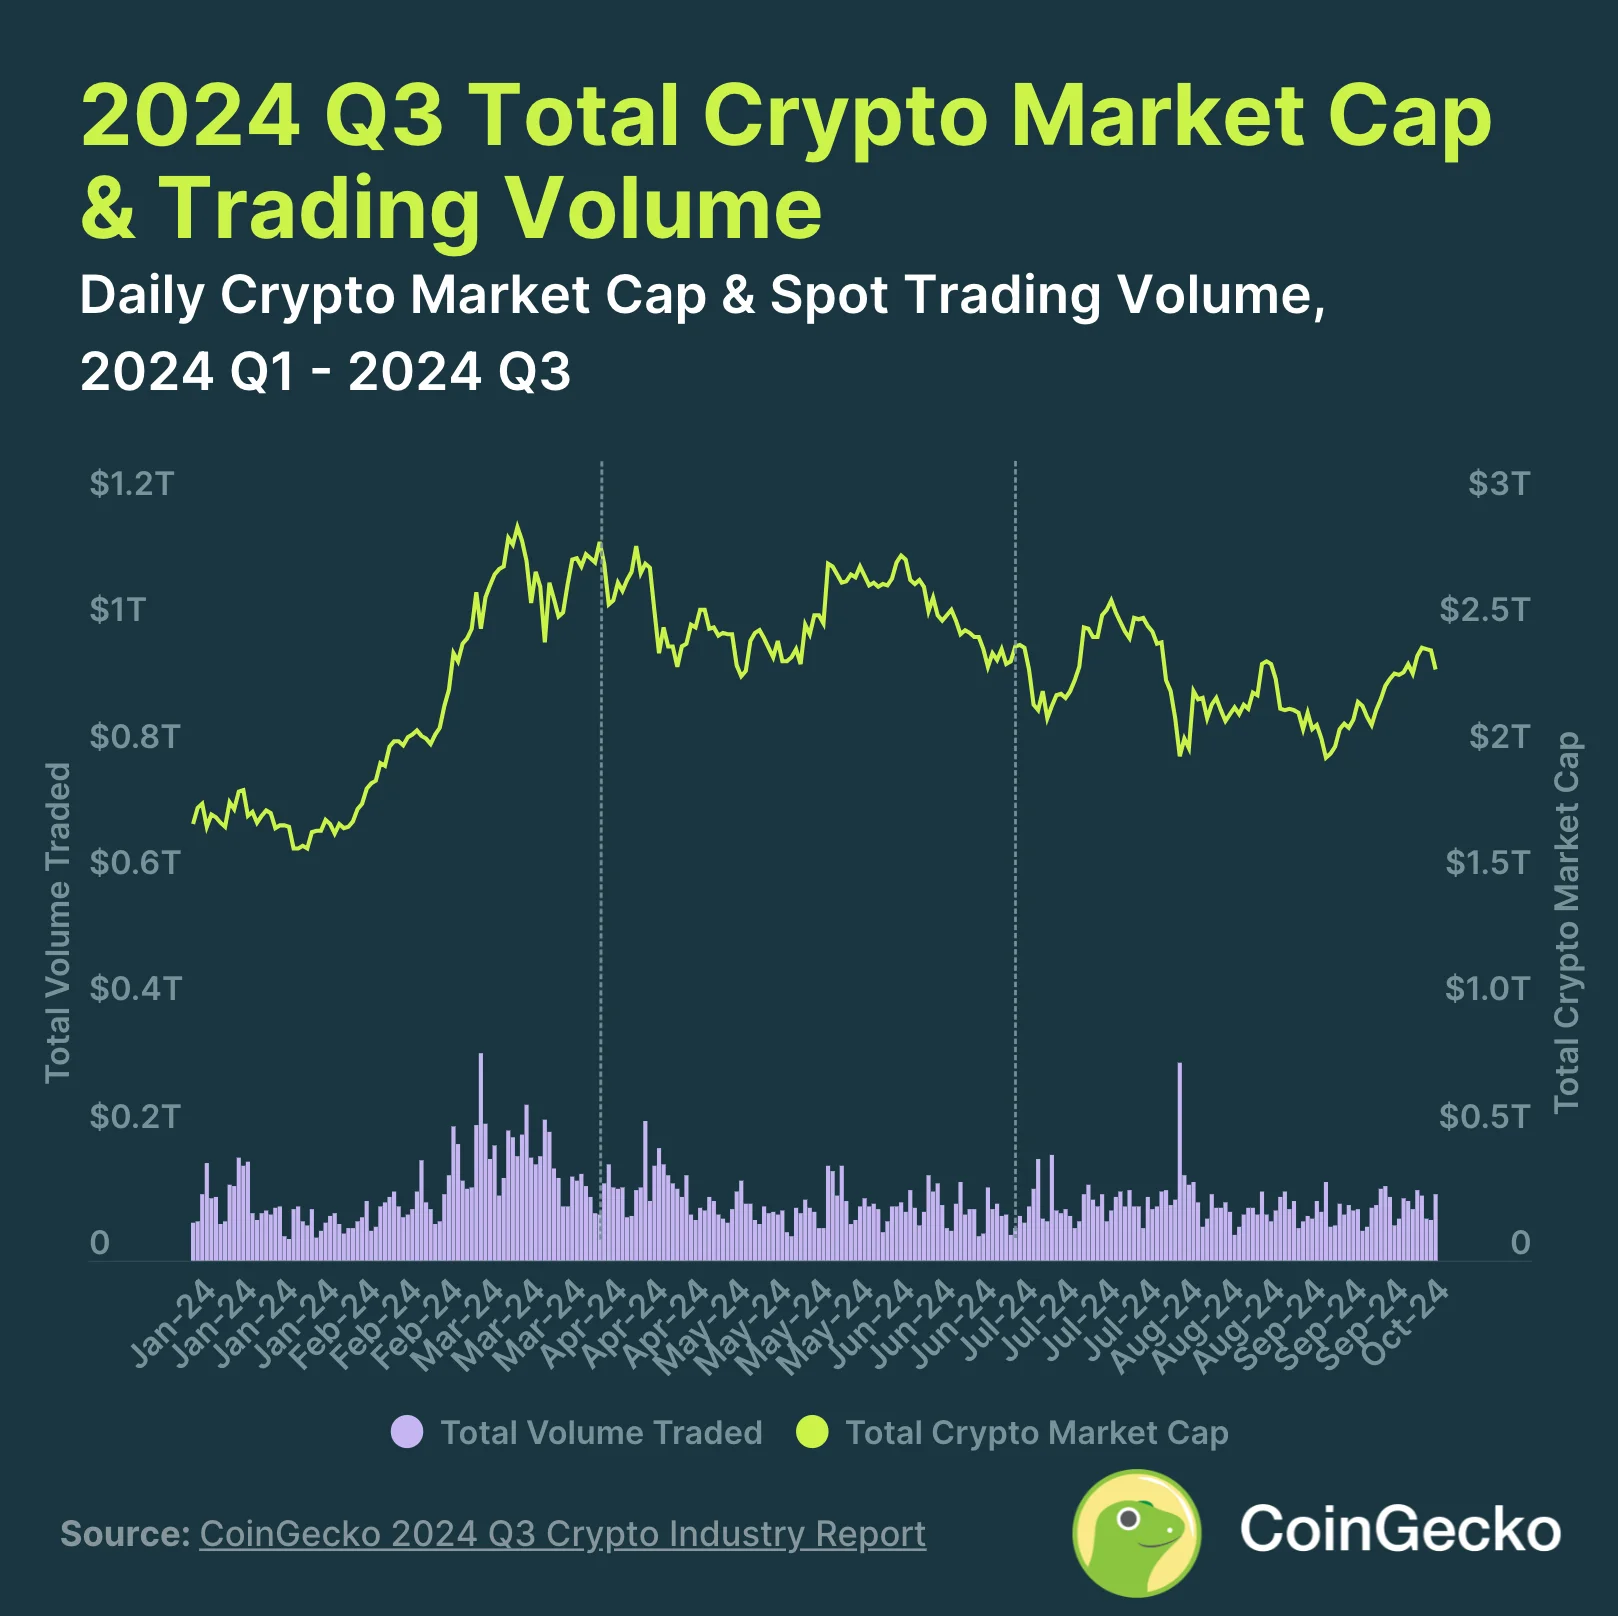
The cryptocurrency market declined by 1% in the third quarter of 2024, finishing at $2.33 trillion. After hitting a high in July, the market fell in August due to global economic pressures.
Interest rates remained unchanged in the U.S., while Japan raised them. After fluctuating between $2.00 and $2.20 trillion, the market slightly recovered thanks to a U.S. interest rate cut and economic stimulus in China.
The average trading volume dropped from Q2 by 3.6% to $88 billion daily.
2. Bitcoin’s Dominance Grows to 53.6%
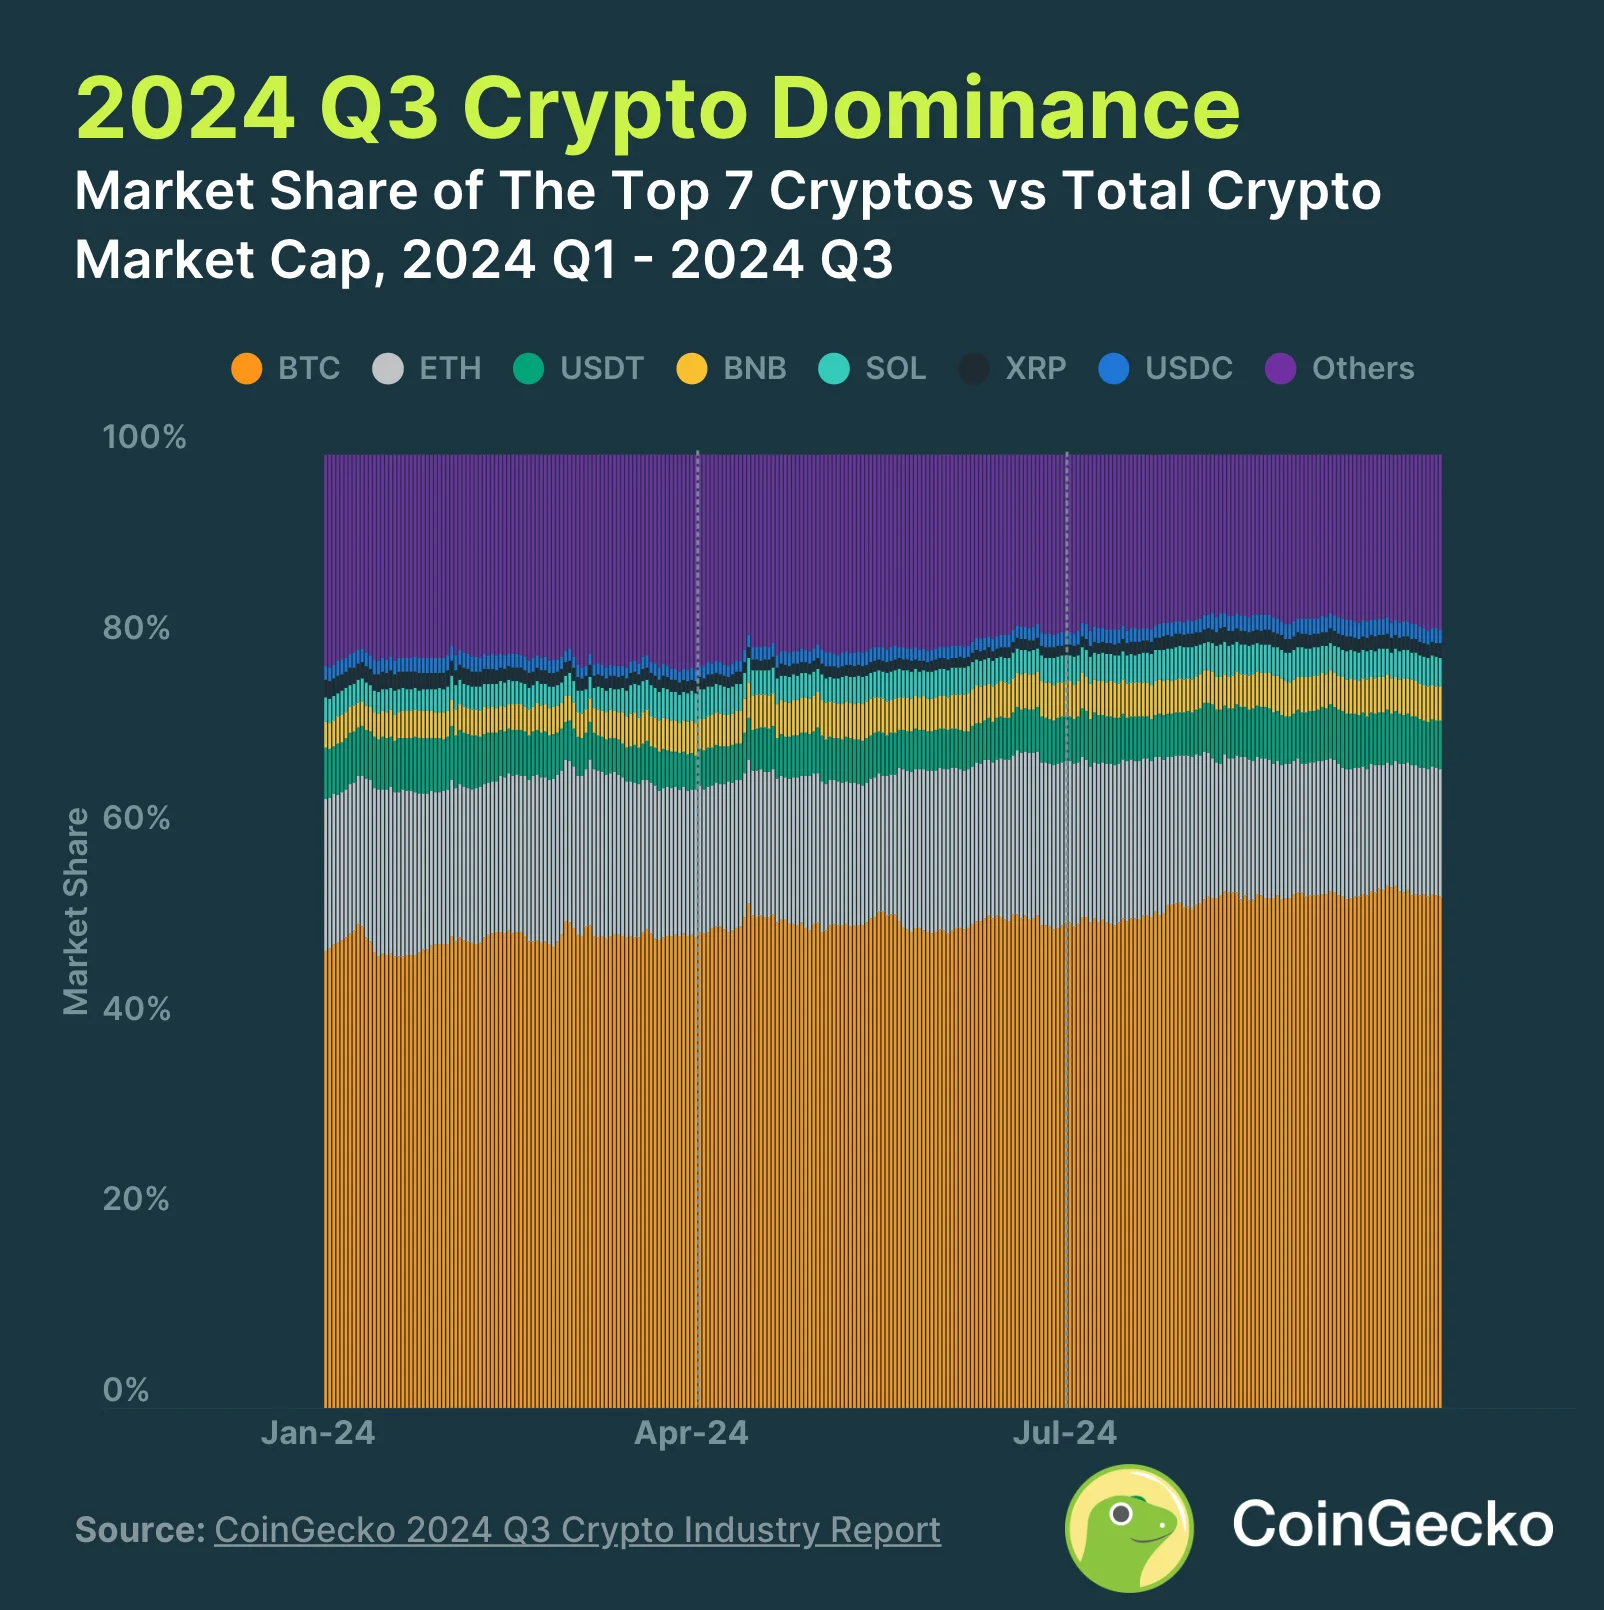
Despite a slight drop in the overall crypto market cap in Q3 2024, Bitcoin’s (BTC) market share grew to 53.6%, up 2.7% from the previous quarter.
Although Bitcoin only saw a slight 0.8% gain, it outperformed other cryptocurrencies like Ethereum (ETH) and BNB, which saw more significant declines in market dominance. This marks the highest level of Bitcoin’s dominance since April 2021.
Ethereum, in particular, had the biggest drop among the top seven cryptocurrencies, losing 3.6% and ending Q3 with a 13.4% market share despite the launch of Ethereum ETFs in July. Decreased interest in Ethereum’s ecosystem likely contributed to the decline.
3. Stablecoins Market Cap Grows by $11B
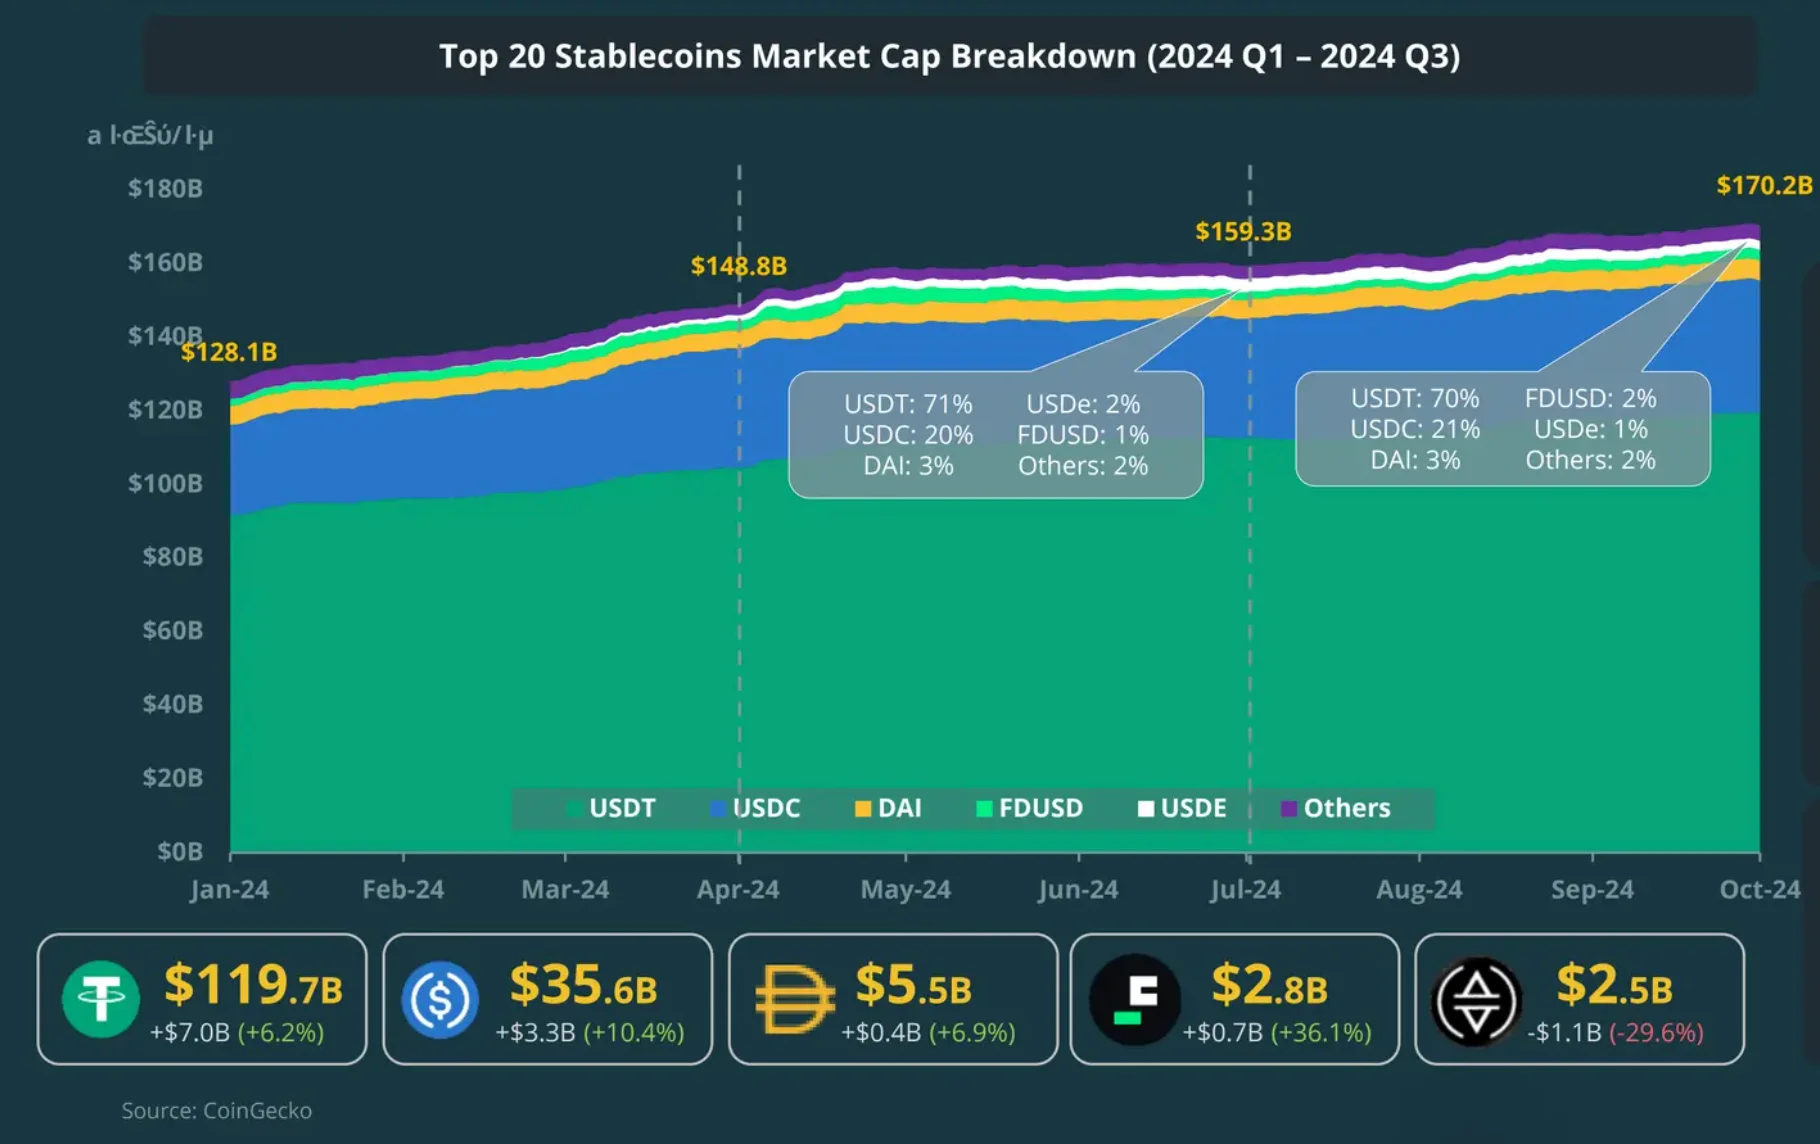
In Q3 2024, the total market cap of the top 20 stablecoins grew by $11 billion, reaching $170.2 billion by the end of the quarter, a 6.9% increase from $159.3 billion.
Tether (USDT) maintained its dominant 70% market share, while USD Coin (USDC) held 21%. Most of the growth came from USDT and USDC, adding $7 billion and $3.3 billion, respectively.
On the other hand, USD-e saw its first decline, with $1.1 billion in outflows, partially due to a sharp drop in its sUSDe APY. Other top gainers included PYUSD (+66.5%) and GHO (+72.5%), while GUSD (-35.3%) and crvUSD (-47.9%) lost the most market cap in Q3.
4. Gold Outperforms Bitcoin, Rising 13.8%
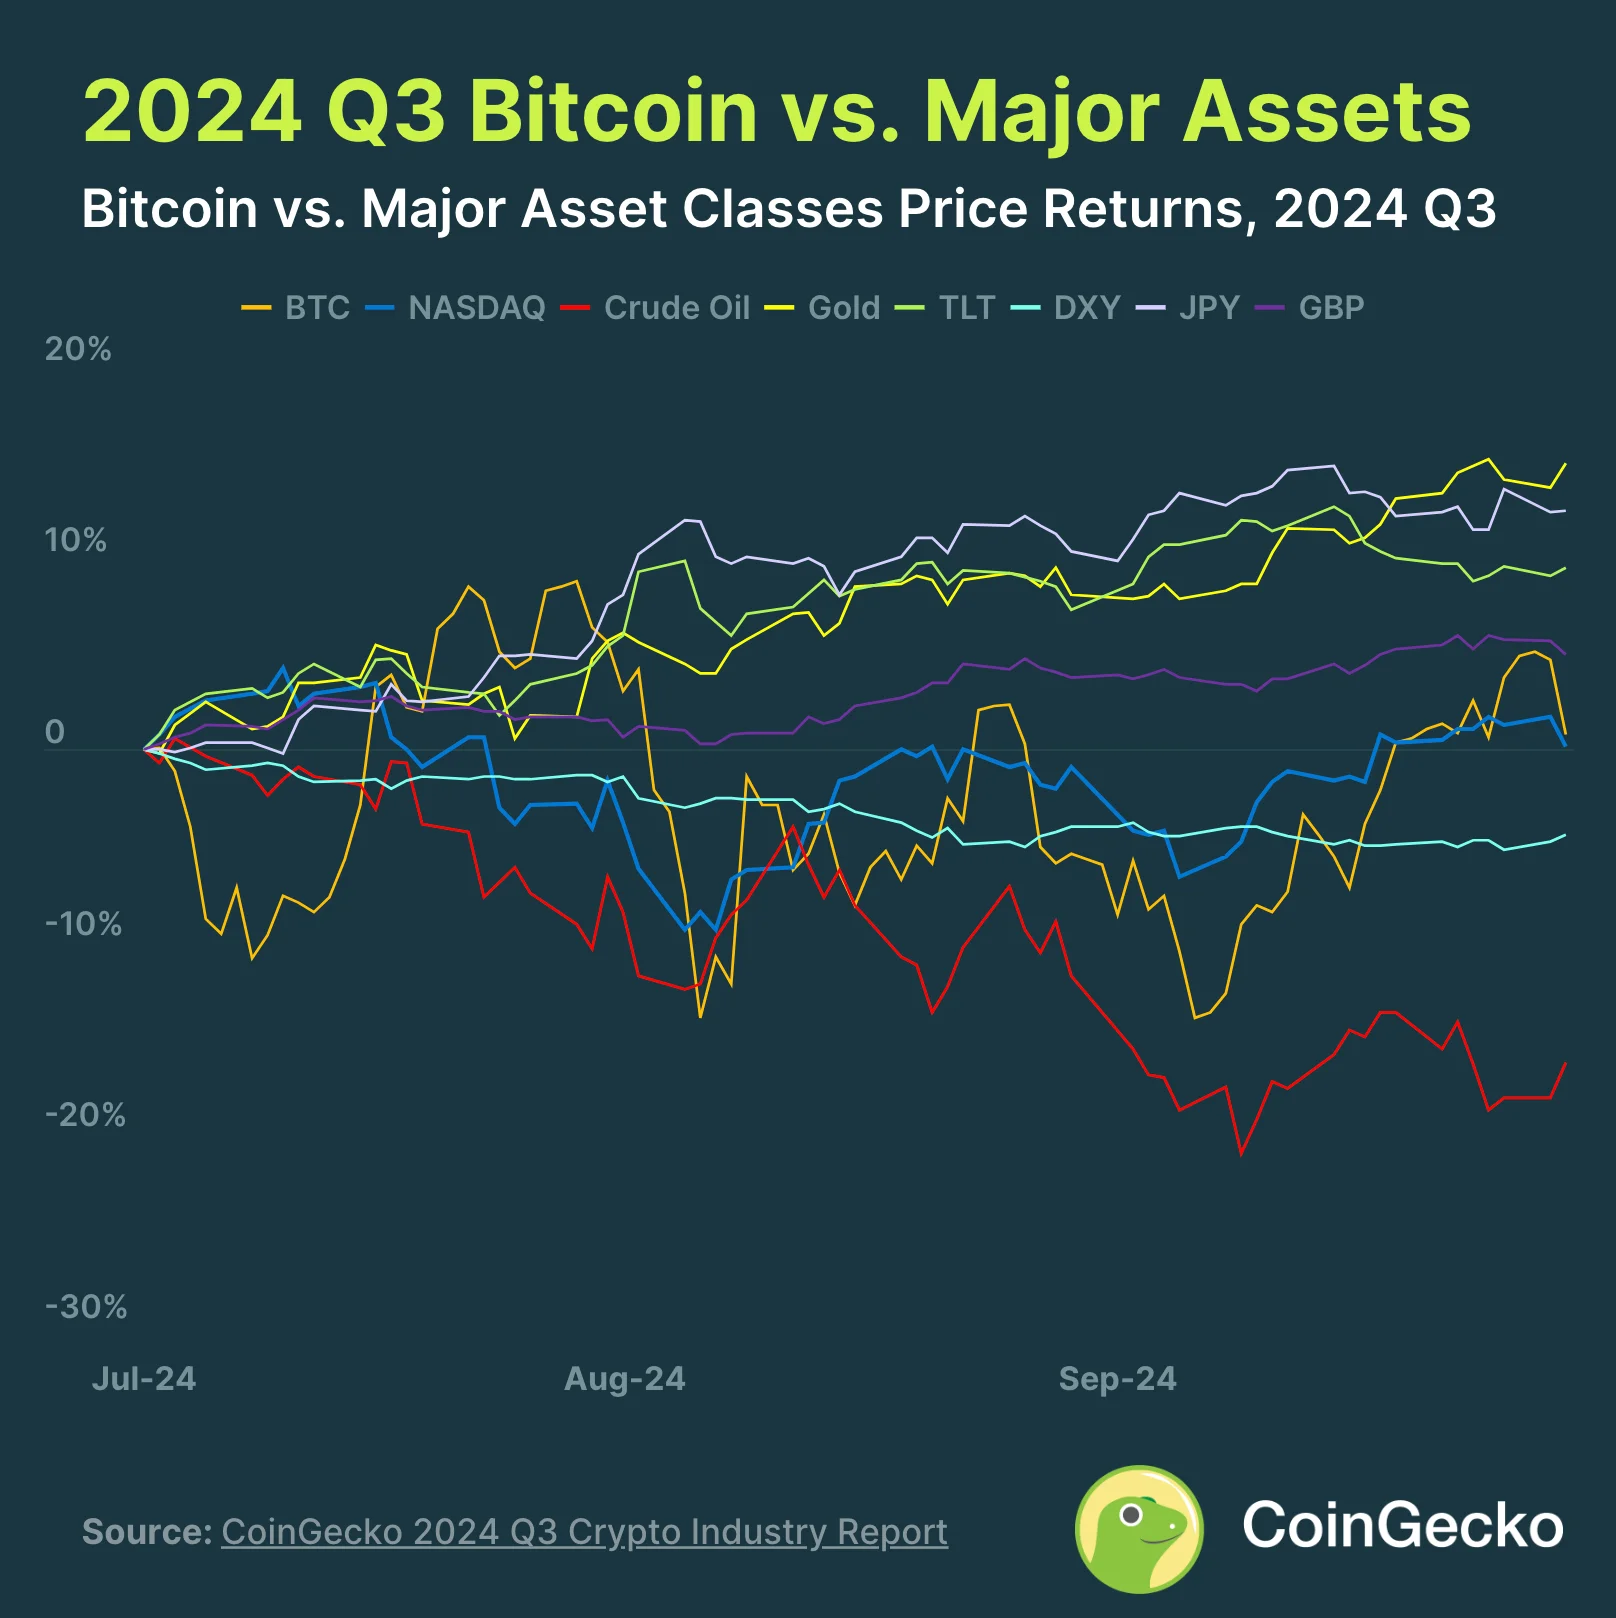
In Q3 2024, Bitcoin saw a modest price increase of 0.8%, but most major asset classes outpaced it. Gold led the way with a 13.8% gain, driven by economic concerns in the U.S. and tensions in the Middle East.
The Japanese Yen also performed well, climbing 12.0% after the Bank of Japan’s surprise rate hike. Only crude oil and the U.S. Dollar Index (DXY) performed worse than Bitcoin due to concerns about demand and interest rate cuts.
All major fiat currencies strengthened against the dollar.
5. Prediction Markets Surge 565.4%
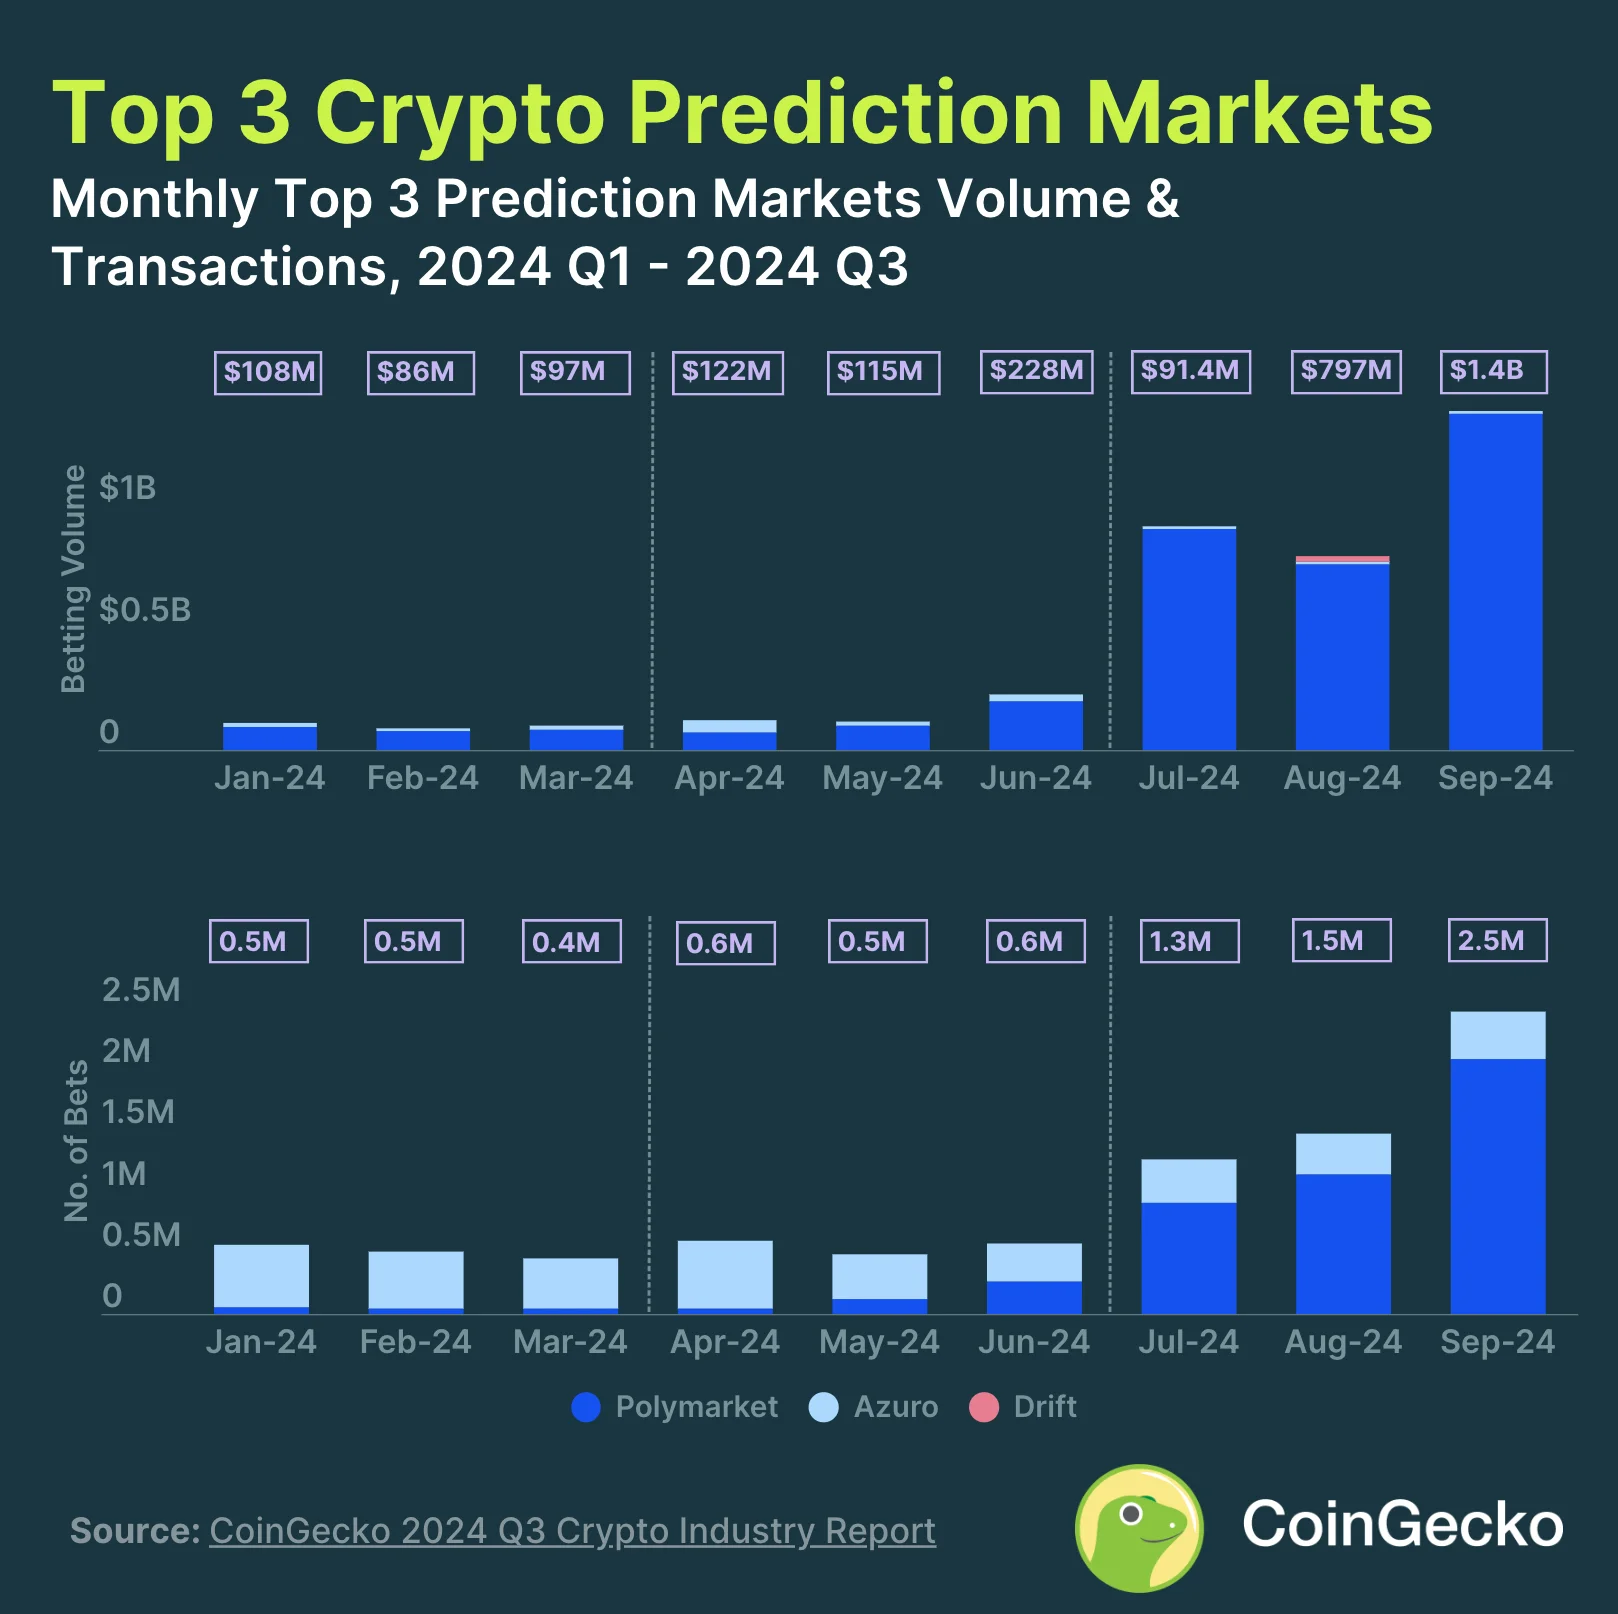
Prediction markets saw tremendous growth, increasing by 565.4% as people bet heavily on the upcoming U.S. elections. The top three platforms reached a combined $3.1 billion in volume, up from $466.3 million in the previous quarter.
Polymarket dominated the space, capturing 99% of the market share, with its betting volume skyrocketing by 713.2%.
Since the start of 2024, $1.7 billion has been wagered on the U.S. Presidential Election, making up about 46% of Polymarket’s total yearly volume.
6. Bitcoin Hash Rate Hit a New All-Time High
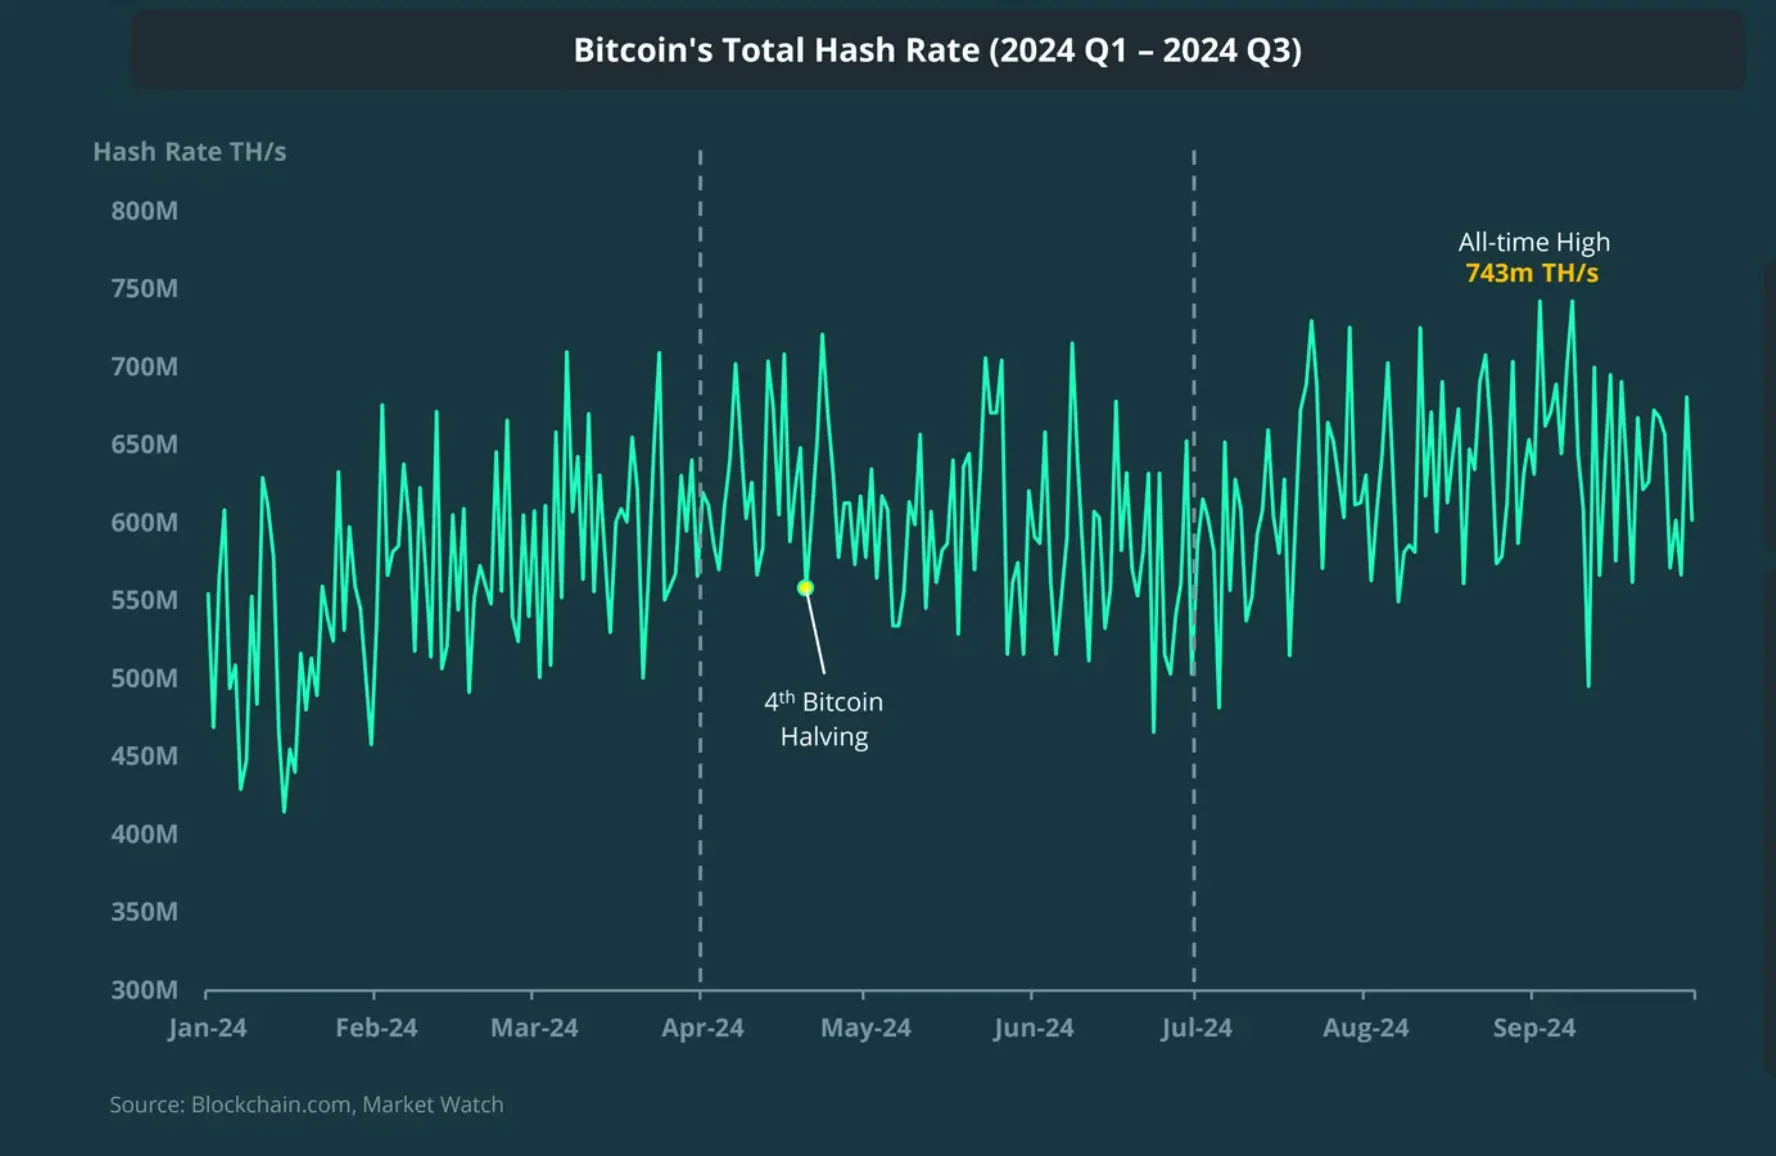
Bitcoin’s total hash rate bounced back from its post-halving decline, increasing by 19.6% in Q3 2024. It grew from 503M TH/s in July to 602M TH/s by the end of the quarter, with the daily average hash rate reaching an all-time high of 743M TH/s in early September.
Despite this growth, miner profitability continued to drop month-on-month, down 6% in September. Other key developments in the mining sector include Russia legalizing crypto mining and five major mining firms expanding into AI by setting up high-performance computing (HPC) facilities.
7. Ethereum Layer 2 Transactions Up 17.2%
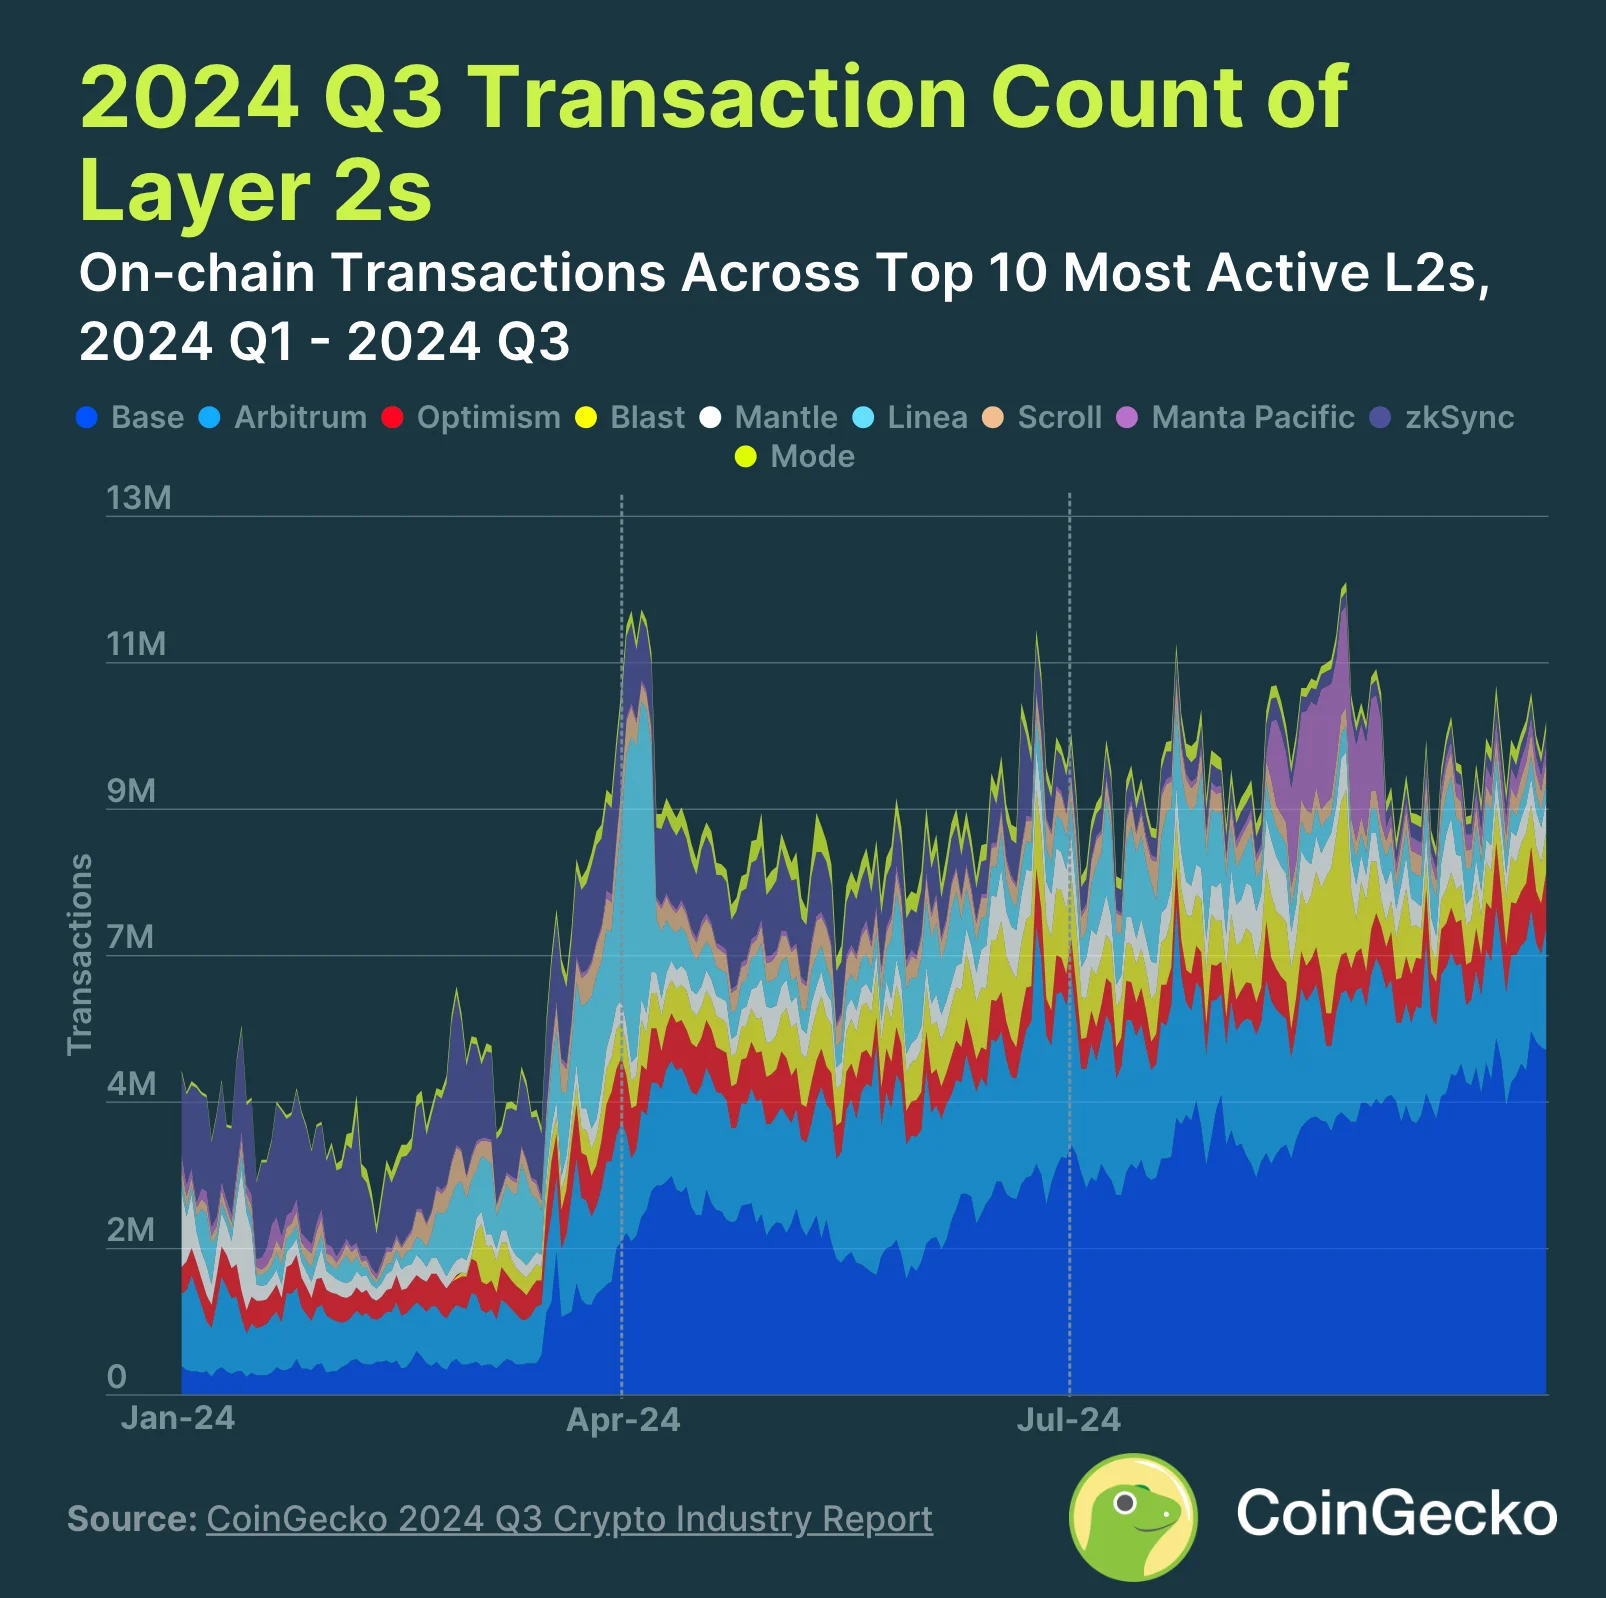
Transactions on the top 10 Ethereum Layer 2 networks increased by 17.2%, reaching almost 10 million daily transactions by the end of September. In contrast, the Ethereum mainnet processes about 1 million transactions daily.
Base led the charge, handling 42.5% of all Layer 2 transactions. Arbitrum was next with 18.9%, followed by Blast at 8.1%.
Manta Pacific saw a spike in August, mainly due to a popular on-chain Telegram app called Taman, but traffic dropped after the initial launch.
8. NFT Trading Volume Declined by 61.3%
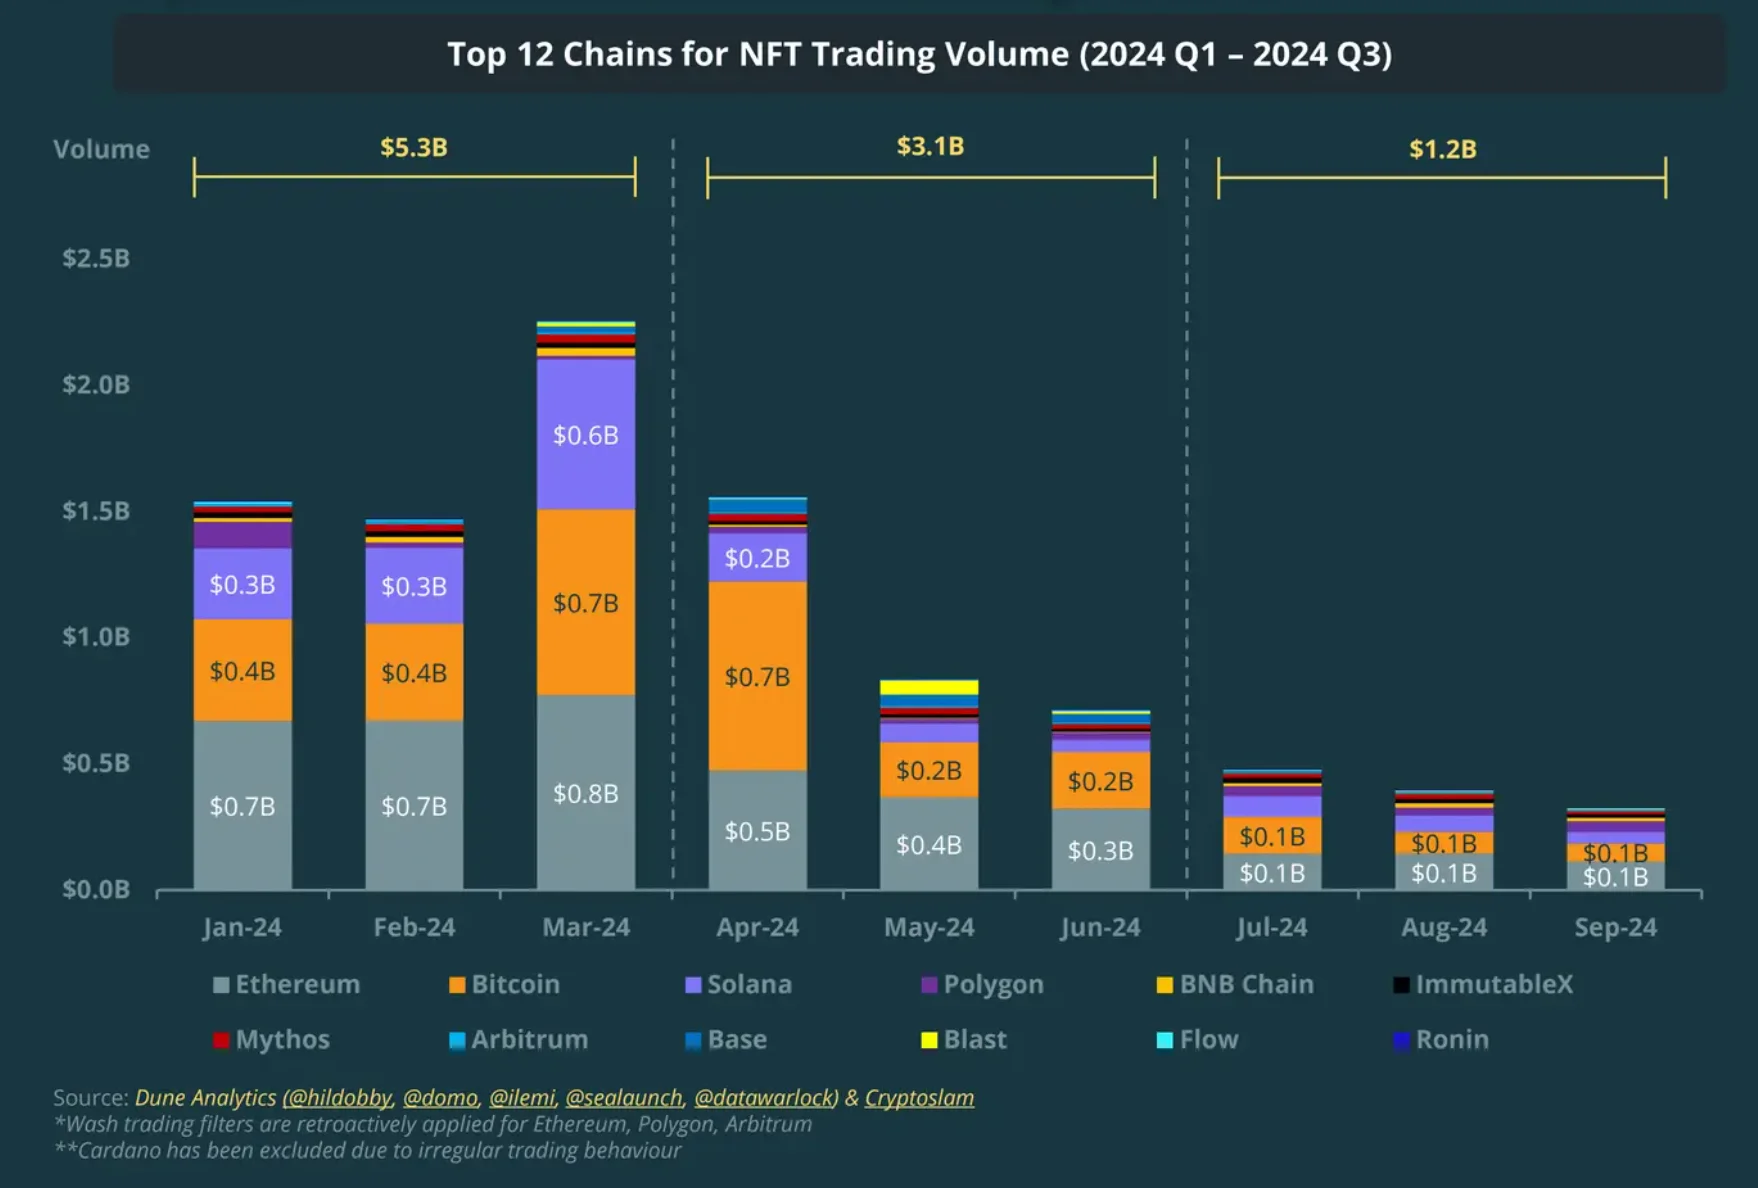
The NFT market saw a sharp drop in trading volume, falling by 61.3% from $3.1 billion in Q2 to just $1.2 billion in Q3.
Ethereum NFTs took a significant hit, with their volume shrinking by 64.7%, dropping Ethereum’s dominance from 45% to 35%. Bitcoin’s NFT trading also declined, but its Ordinals activity still accounted for 25.2% of the total volume, surpassing Solana’s 16%.
Layer 2 chains like Blast and Base continued to see some NFT activity thanks to popular collections and games, but their volumes also plunged, generating around $3 million in Q3.
Despite the downturn, Layer 2 networks now control 7% of NFT trading volume.
9. Centralized Exchange Spot Trading Volume Drops to $3.05T
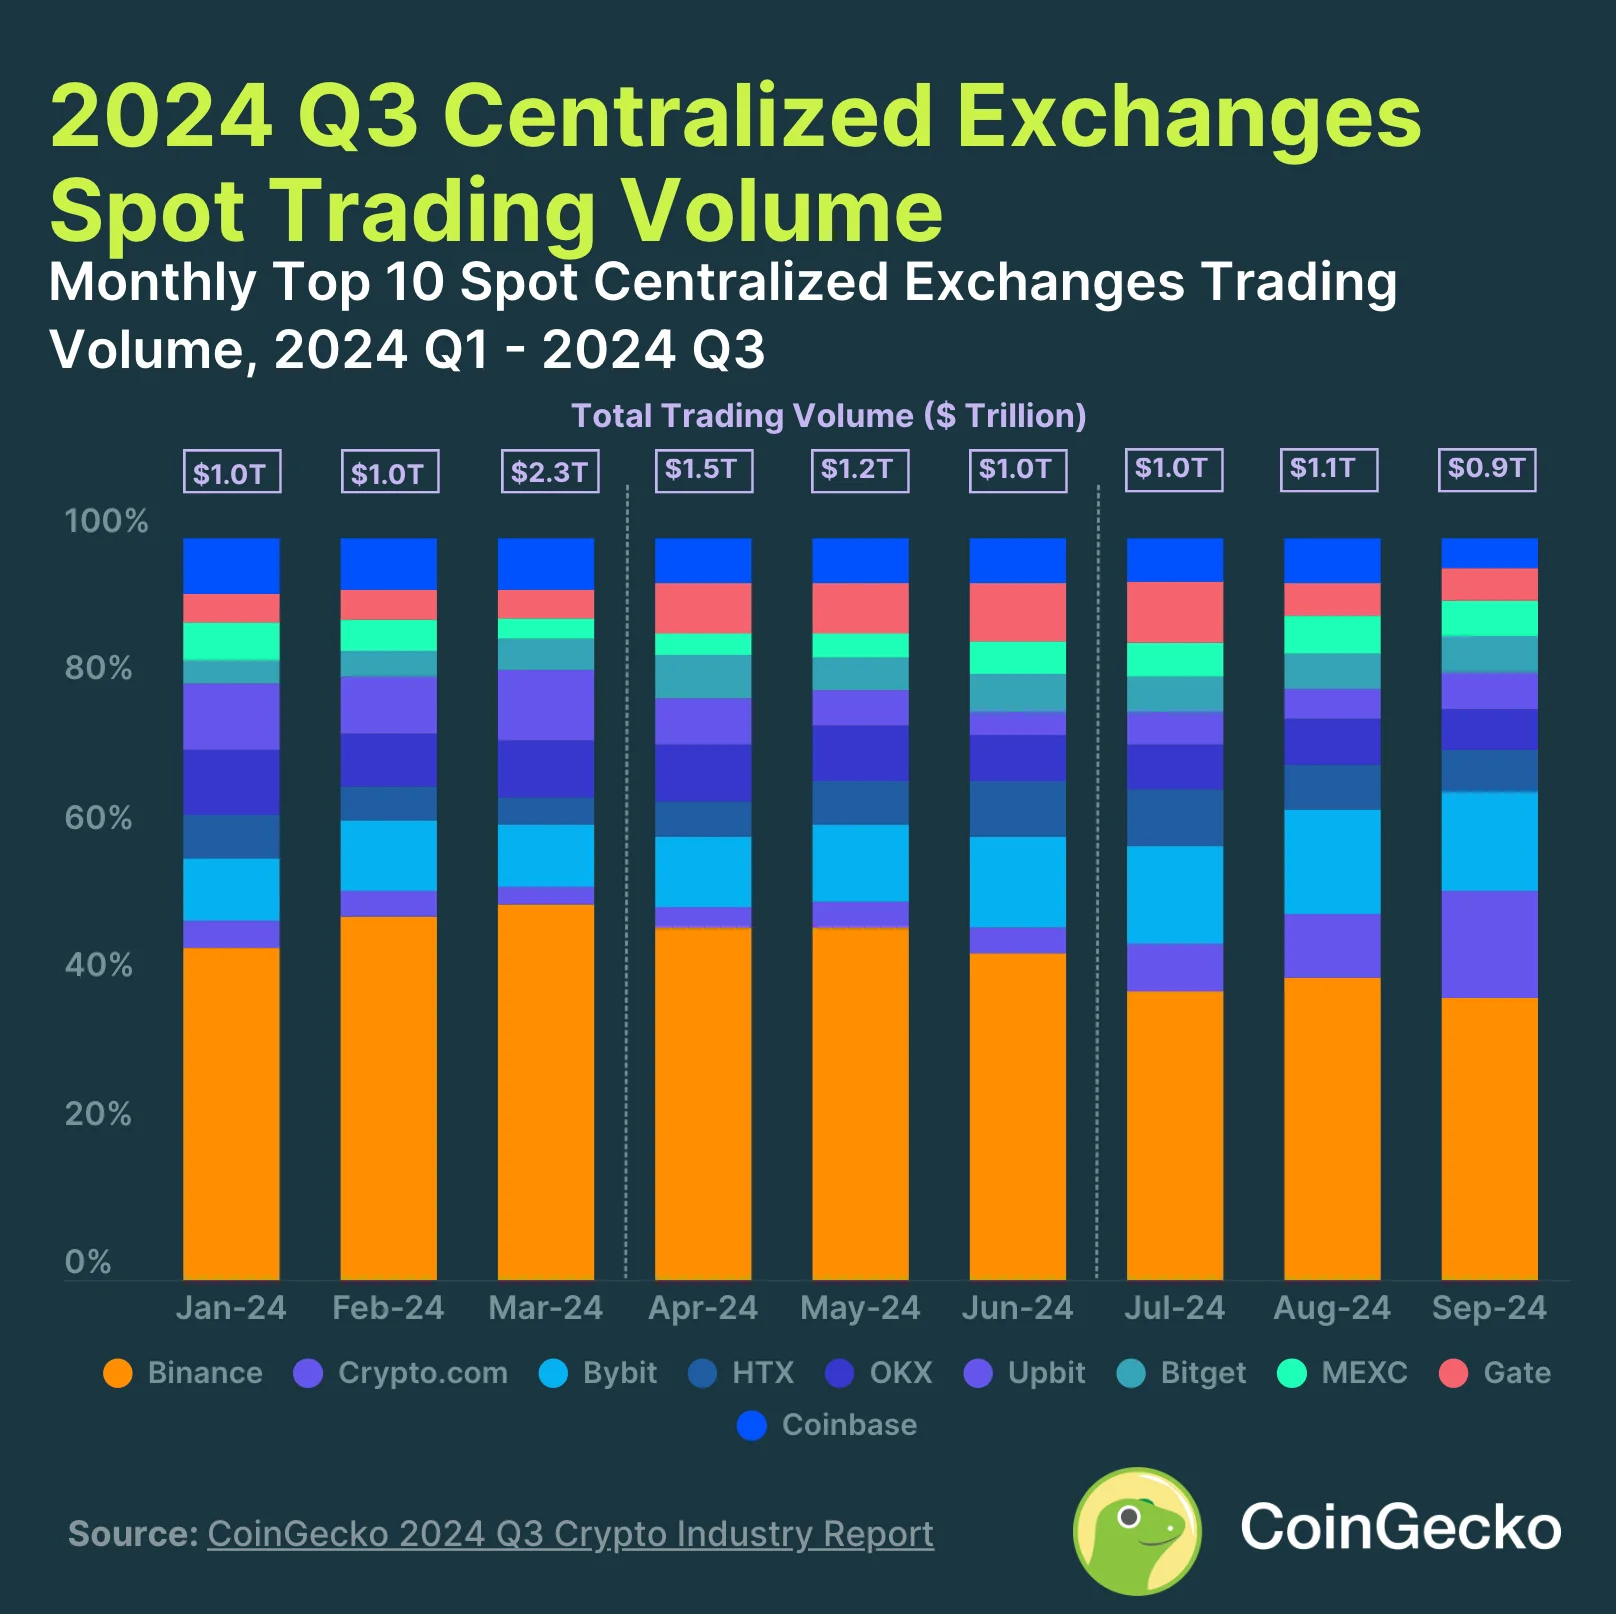
CoinGecko’s report shows that the top 10 centralized exchanges (CEXs) had a spot trading volume of $3.05 trillion, which is a decrease of 14.8% from the previous quarter.
Binance still leads as the largest CEX, but its market share fell below 40% for the first time since January 2022, finishing at 38% in September. Crypto.com made a big leap from ninth to second place, growing its trading volume by 160.8% and achieving a 14.4% market share.
On the other hand, OKX and Gate.io both saw their trading volumes drop by more than 30%. Coinbase also experienced a 23.8% decline, dropping from sixth to tenth place in the rankings.
10. Ethereum’s DEX Trading Dominance Slips as Solana and Base Gain Ground
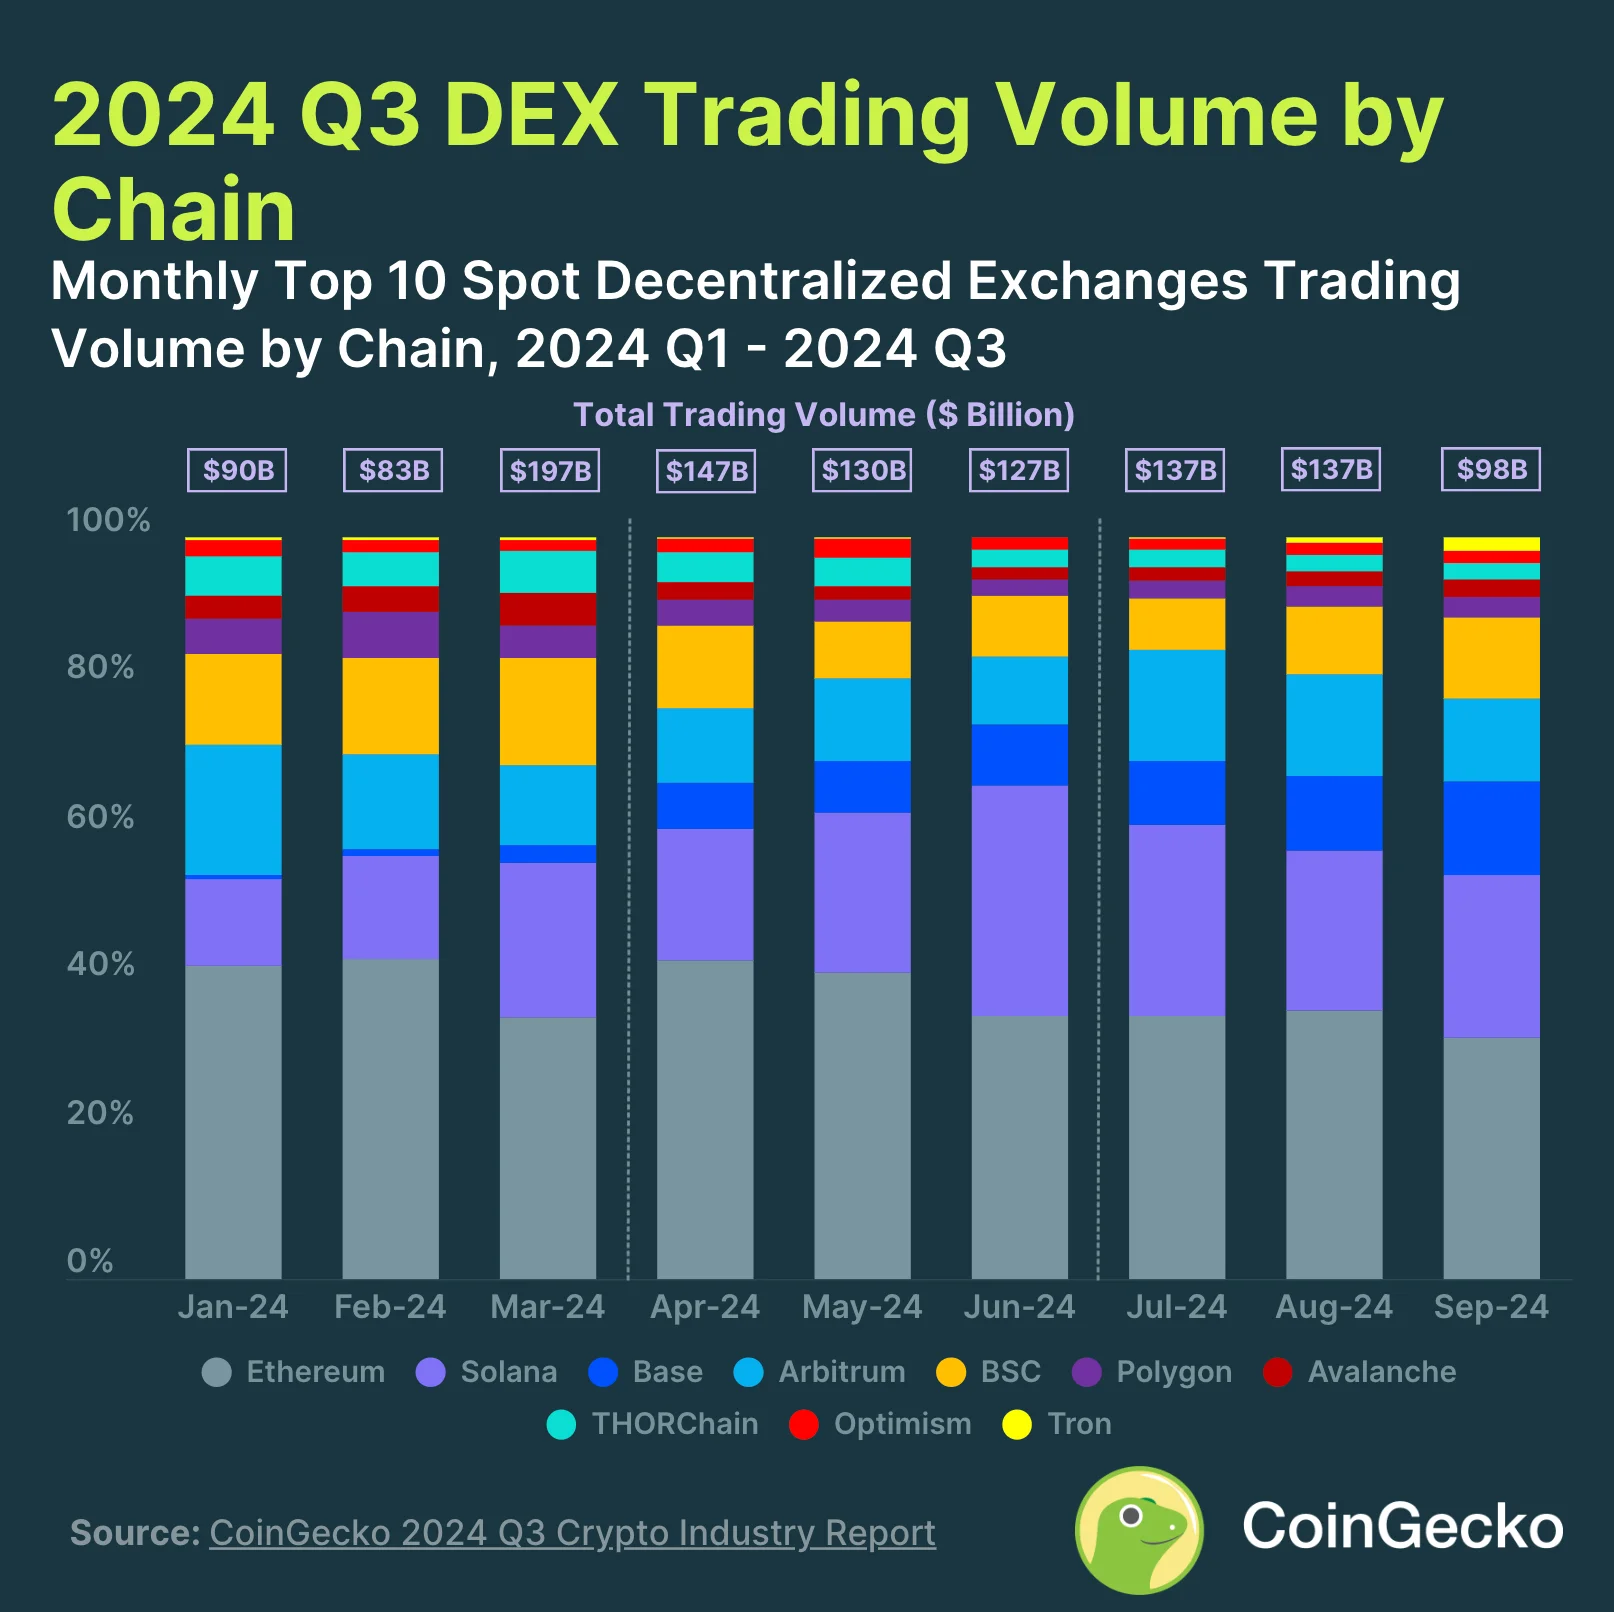
Ethereum remained the leading chain for DEX trading, but its market share dropped below 40% as trading volumes decreased by nearly 20%, reaching $130.5 billion.
Solana gained ground thanks to the popularity of meme coins, capturing 22% of the market with $21.5 billion in trades.
Base also grew, increasing its market share to 13% with $12.3 billion in volume.
Tron entered the top 10, boosted by the release of the SunPump memecoin generator, taking 2% of the market with $1.7 billion in trades.
Final Thoughts
So, as you can now see clearly, the cryptocurrency market in Q3 2024 faced significant changes shaped by global economic shifts and geopolitical decisions.
While there were no dramatic price swings, the sector remained dynamic, with various forces driving activity across different segments.
For anyone invested in or following the crypto industry, staying informed will be key to navigating its complexities in the coming months. So, until the next CoinGecko report, take advantage of the above information and good luck.